Web Inspector ReferenceSources Tab
The Sources Tab is the one-stop shop for all things related to the inspected target’s resources, including dynamic resources from things like XMLHttpRequest or fetch.
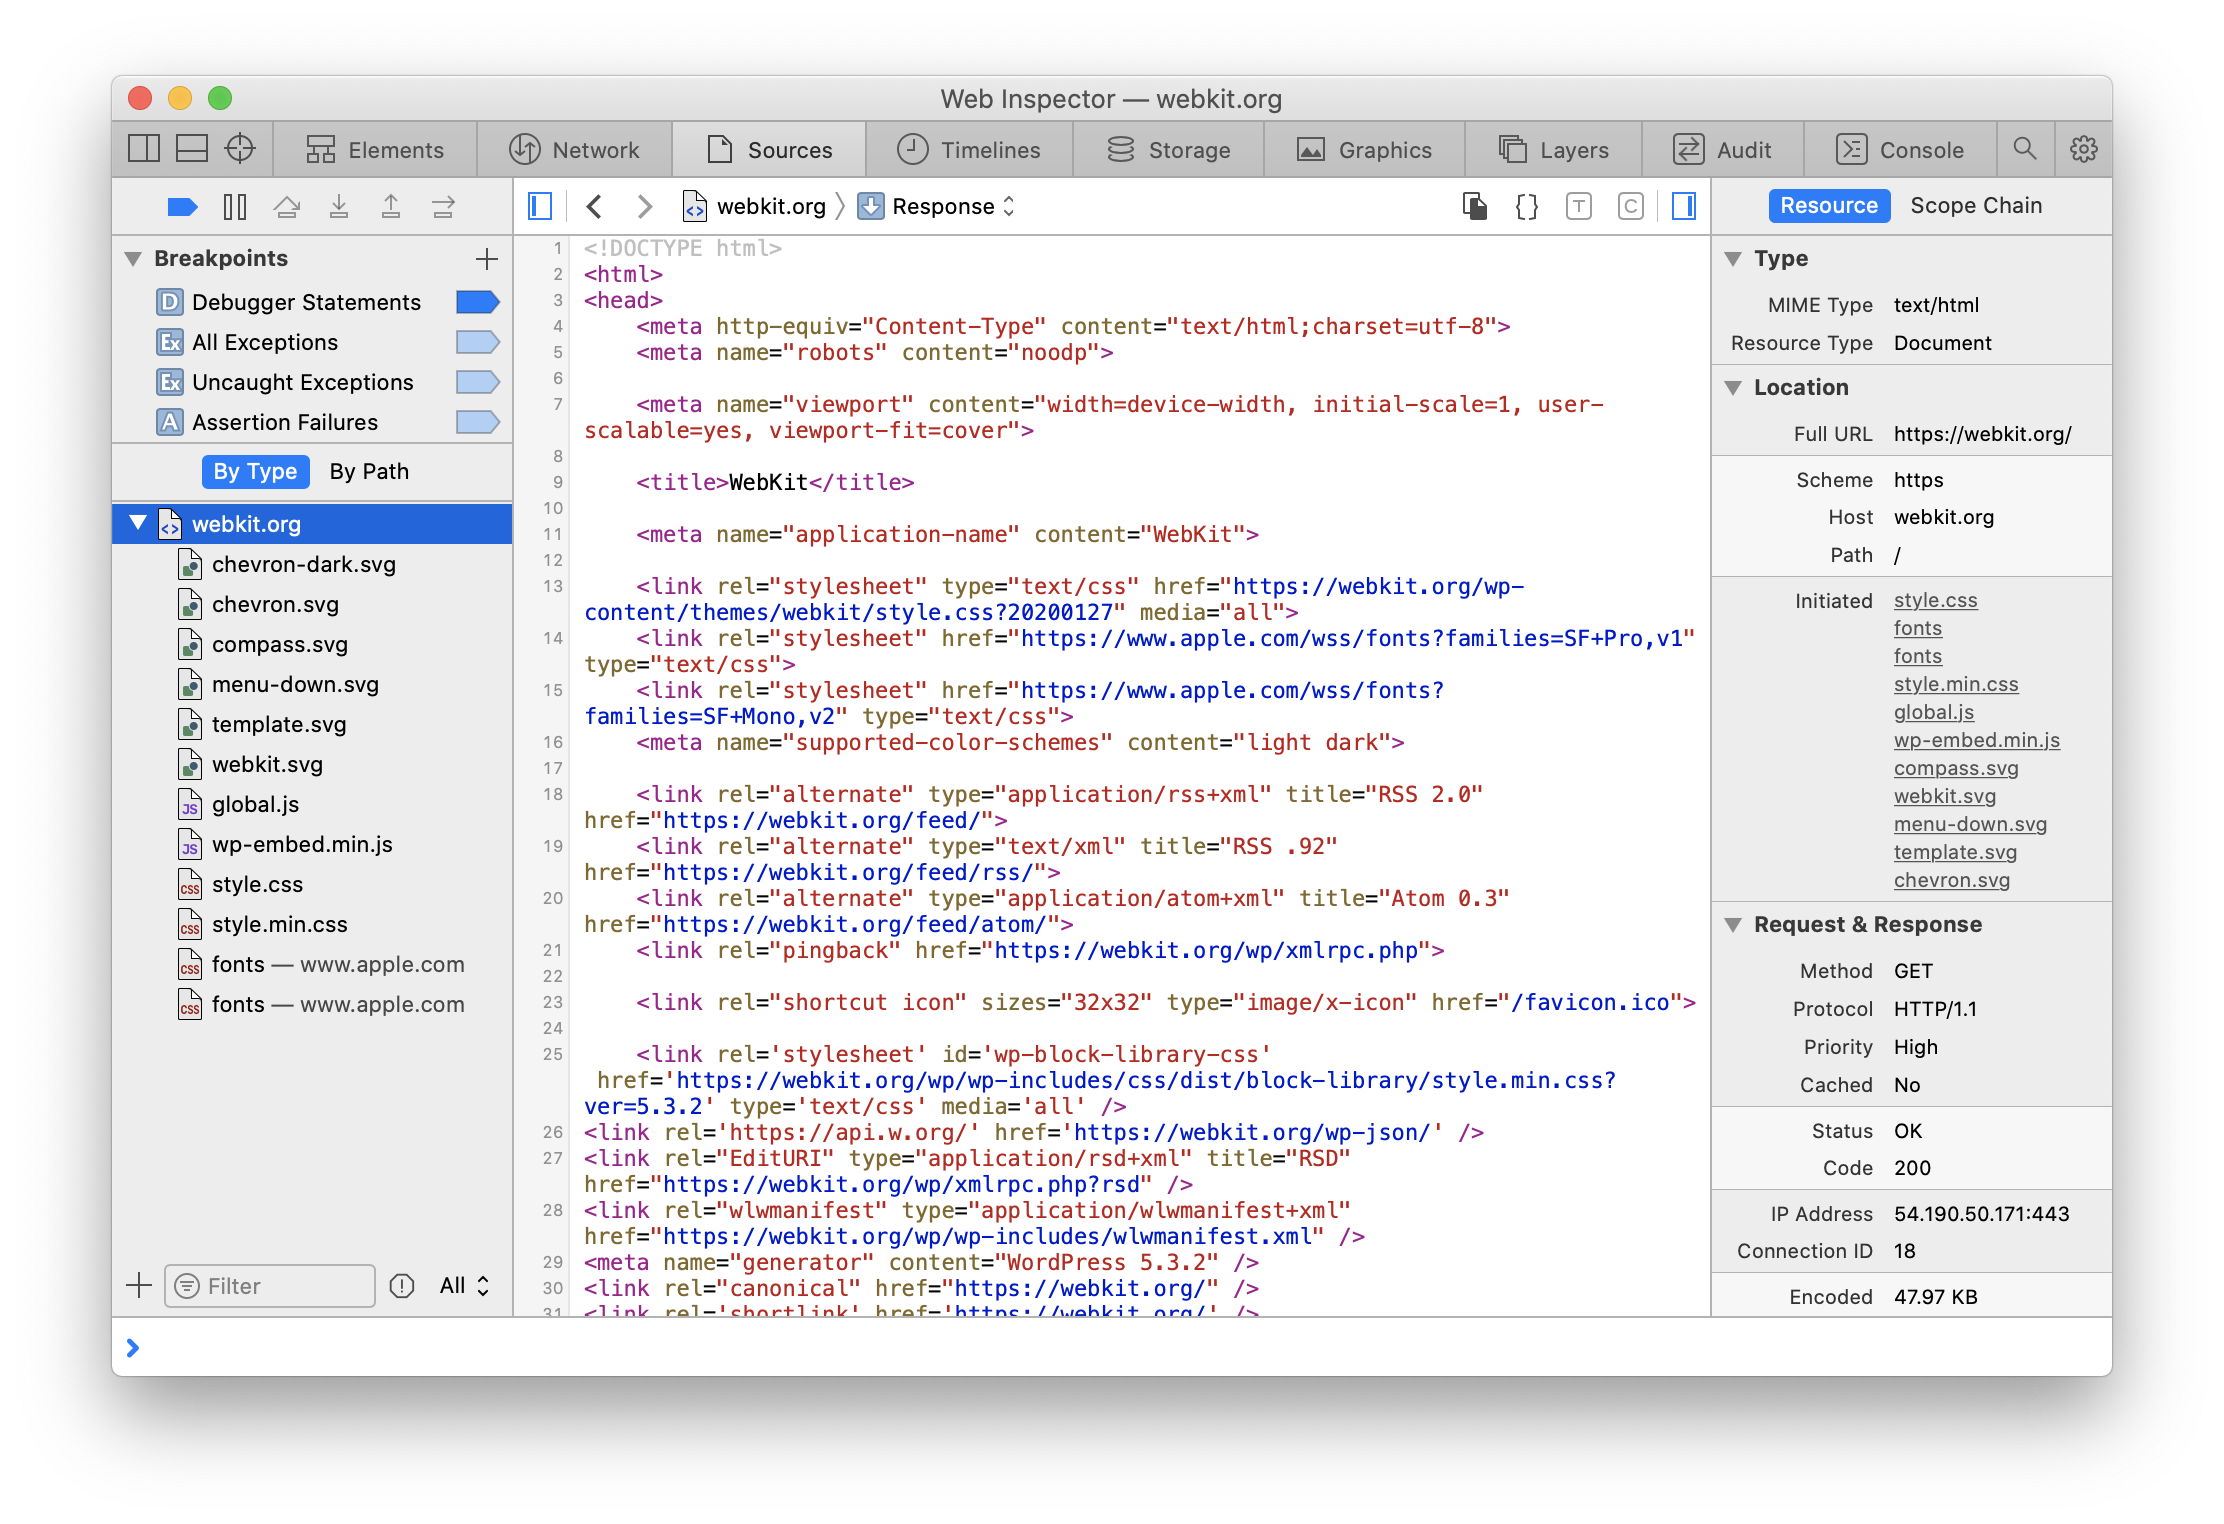
Organizing Resources
By default, resources are organized By Type in the Navigation Sidebar, which places resources of similar type (e.g. Images, Scripts, Style Sheets, etc.), but only if there are so many resources that it would be confusing to navigate as a flat list.
It’s possible to switch the organization to be By Path, which instead creates a hierarchy of folders that match the path of each resource.

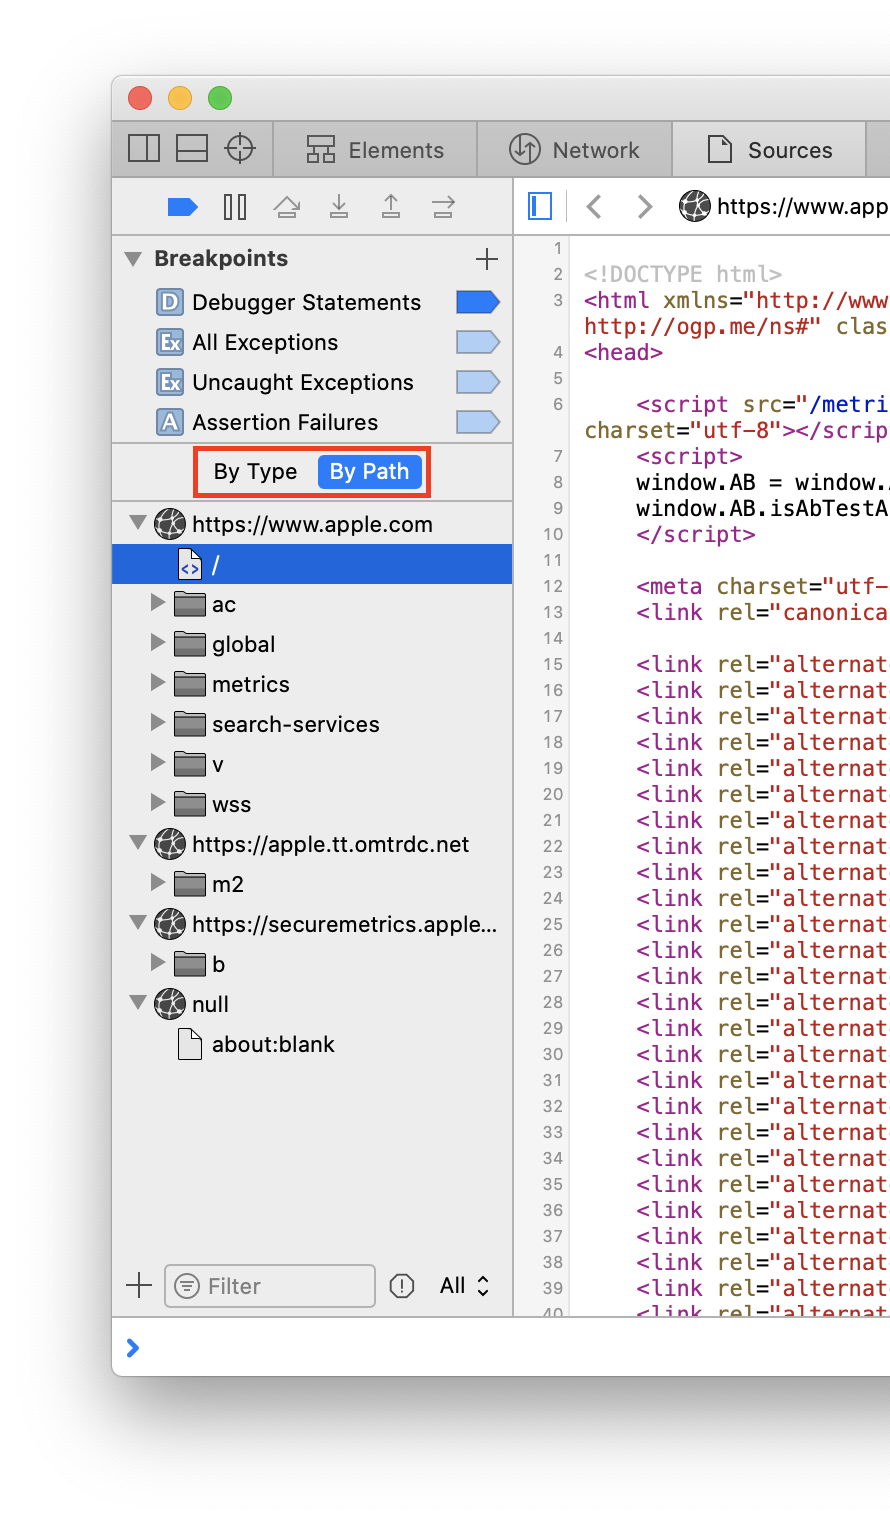
When organizing By Path, each origin is listed at the top-level, instead of in a Frames folder nested under the main resource.
Filtering Resources
The filter bar in the bottom of the Navigation Sidebar will show/hide resources based on whether the given search string exists in the URL of that resource.
When enabled, console functions).
If the resource type selector is not set to All, only resources that match the selected type (e.g. Images, Scripts, Style Sheets, etc.) will be shown.
Understanding Resources
In addition to being able to view the response content of the resource in the Main Content Area, Web Inspector also supports showing request data (assuming it exists), and will also show alternate representations of the content where applicable.
- If the request data or response content is JSON parseable, an object tree view is made available as if the contents had been logged to the Console.
- If the request data or response content is valid XML (including HTML and SVG), a DOM Tree view is made available as if the contents had been shown in the Elements Tab.
- If the response content is XML-like or valid JavaScript or valid CSS,
- If the response content is valid JavaScript,
- If the response content is valid JavaScript,
- If the response content is an image,
Additional information about the resource is also shown in the Resource panel in the Details Sidebar, such as MIME type and request/response headers.
Creating Inspector Resources
In addition to showing resources loaded by the inspected target, Web Inspector also has three different types of resources that can be created:
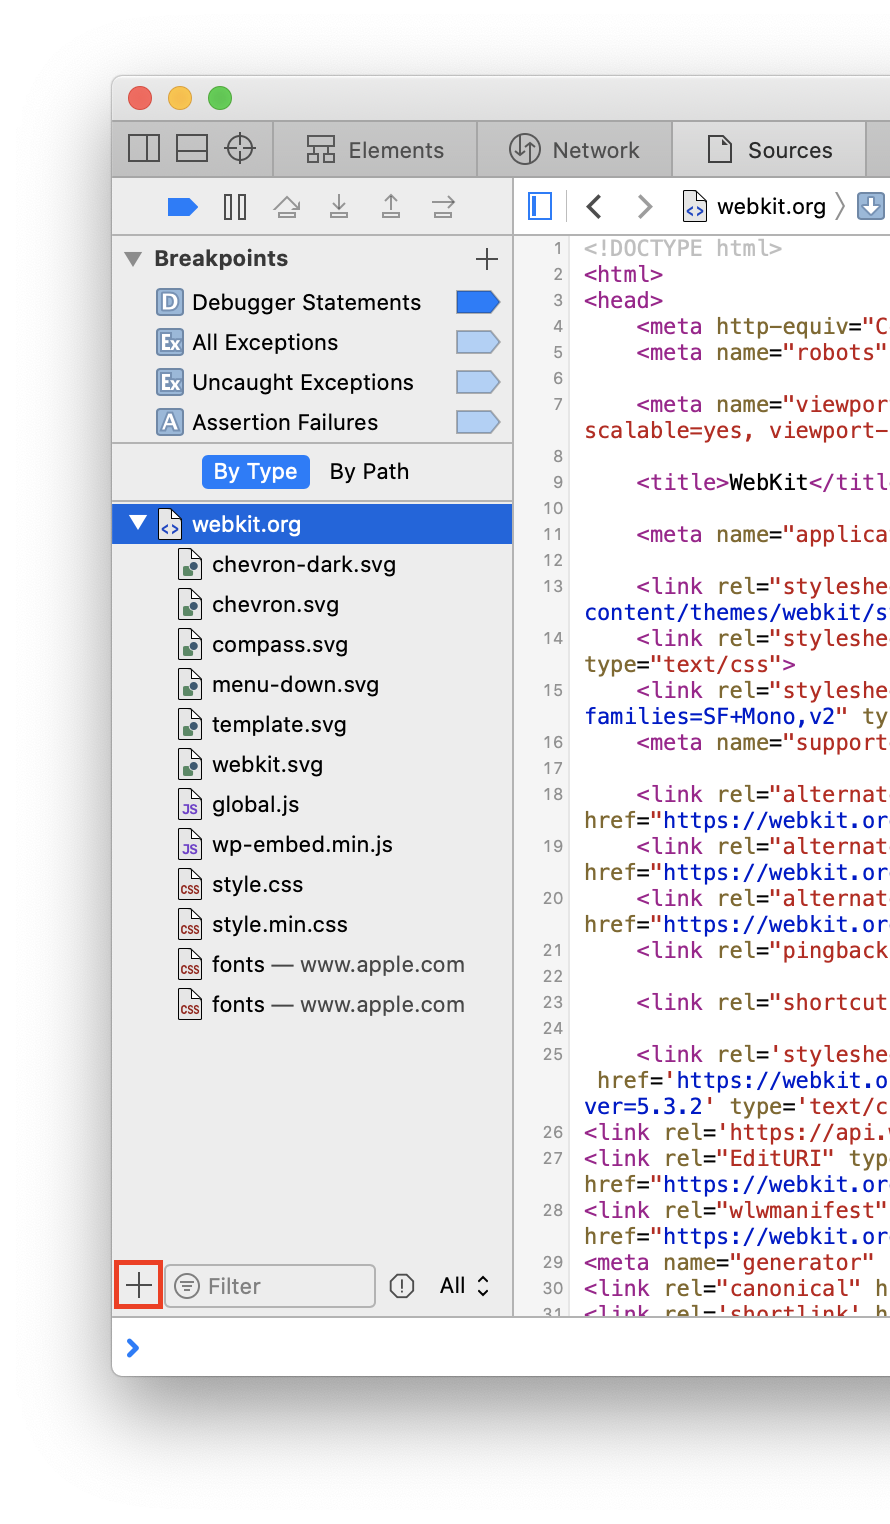
- Local Override… can be used to replace the content and headers of any network response, based on URL, so long as Web Inspector is open.
- For more information, please read Local Overrides.
-
Console Snippet… allows for saving snippets of JavaScript into a resource to avoid having to repeatedly type (or copy and paste) that code in the Console.
- For more information, please read Console Snippets.
- Inspector Bootstrap Script is a special JavaScript snippet that is guaranteed to evaluate before any other JavaScript in any page, as well as any sub-frames, so long as Web Inspector is open.
- For more information, please read Inspector Bootstrap Script.
- Inspector Style Sheet is a special
<style>that is created by Web Inspector and silently added to the inspected page. - One Inspector Style Sheet can be created per frame.
- Each Inspector Style Sheet is nested underneath its owner frame in the resource tree.
- When adding new CSS rules in the Elements Tab, if there is not already an Inspector Style Sheet for the owner frame, one is automatically created.
- Inspector Style Sheet are not preserved across navigations or between Web Inspector sessions.
Debugging JavaScript
At the top of the Navigation Sidebar, there are some clickable icons that control the JavaScript debugger:
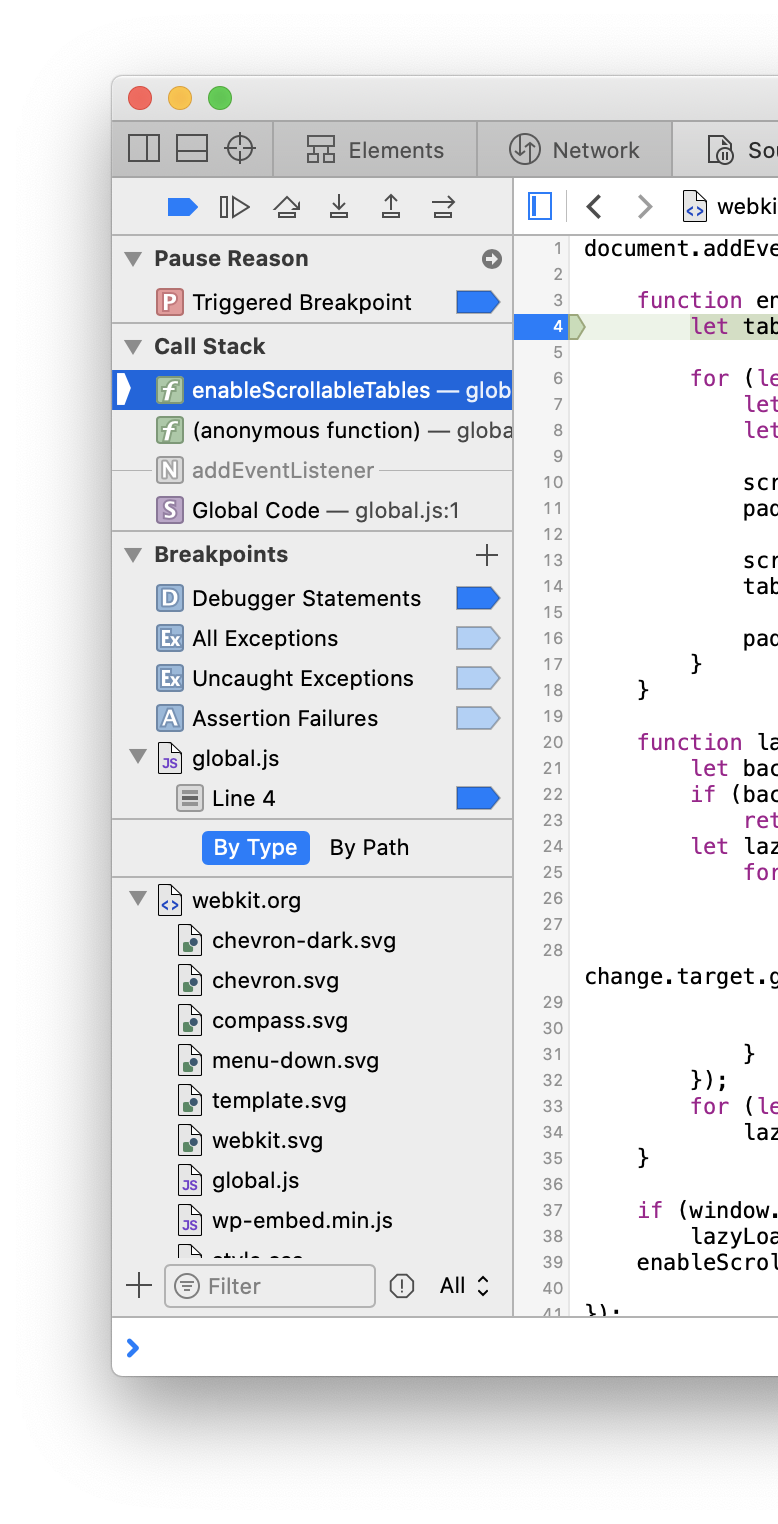
⌘Y.⌘Y.⌃⌘Yor⌘\.⌃⌘Yor⌘\.⌘'orF6.⌘;orF7.⇧⌘;orF8.⇧⌘'orF9.
Below these icons is the Breakpoints section, which contains all existing JavaScript Breakpoints, Symbolic Breakpoints, Event Breakpoints, DOM Breakpoints, and URL Breakpoints, as well as a
When JavaScript execution is paused, additional sections are added to the Navigation Sidebar that contain information about the current Pause Reason and Call Stack.
When debugging code involving asynchronous activity (e.g. queueMicrotask, setTimeout, addEventListener, etc.), if Web Inspector was opened before the asynchronous task was enqueued, the location of where that happened will also be included in the Call Stack section.

Keep in mind that these call frames are not active, meaning that you won’t have access to any local values for those frames. They are there purely to help you understand how you got to that point. In these cases, the current evaluation context is indicated by a
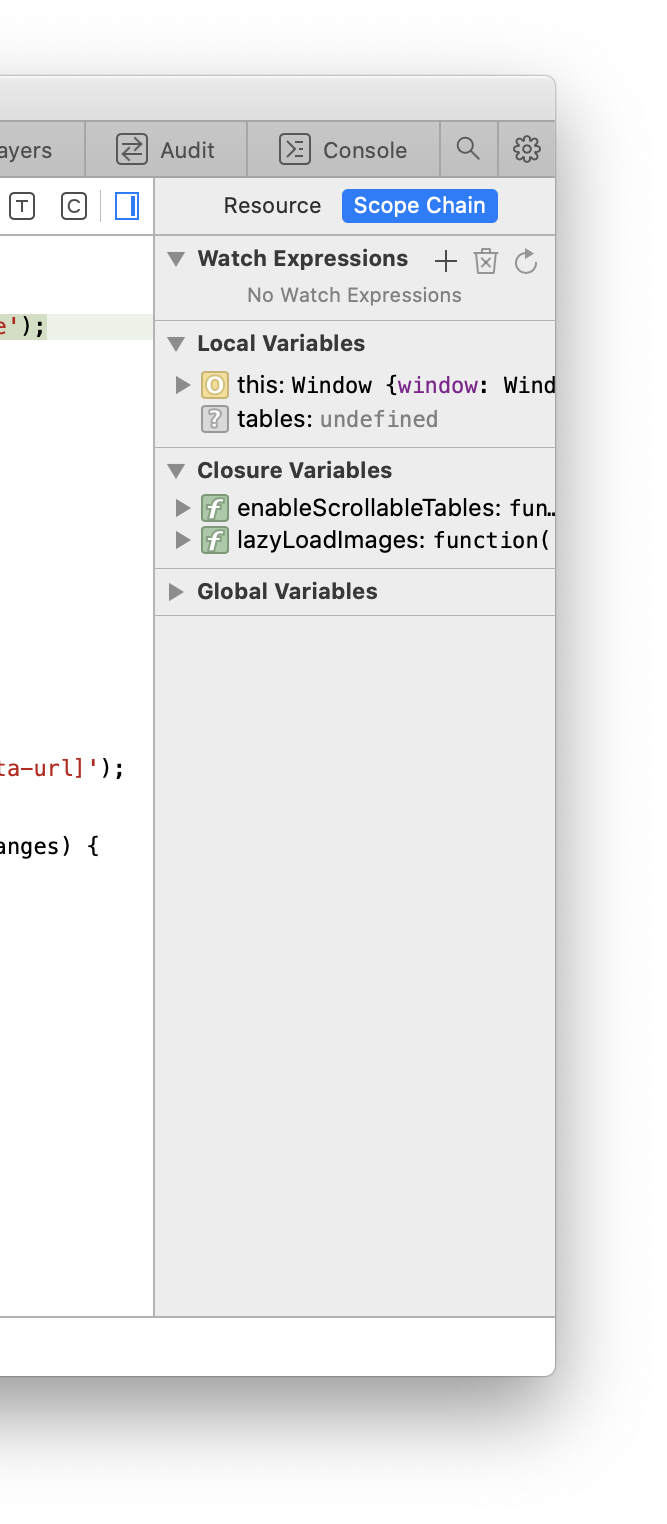
If the Show Scope Chain on pause setting is enabled in the Sources pane in the Settings Tab, whenever JavaScript execution is paused, the Scope Chain panel in the Details Sidebar will be automatically shown, which contains information about all variables that exist in each scope that is visible from the current JavaScript execution point.
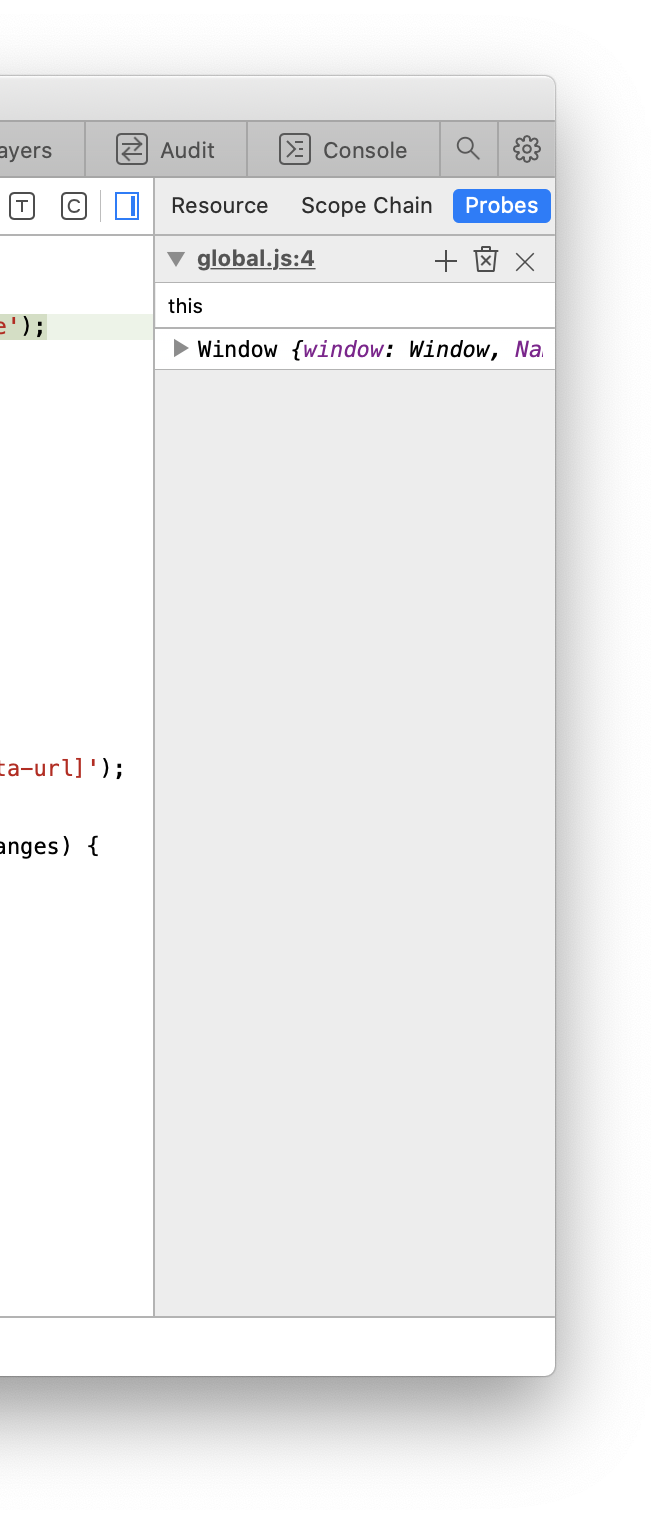
If there are any breakpoints with a Probe Expression action, the Probes panel in the Details Sidebar is shown.


 Updated for