Introducing JSC’s New Sampling Profiler
JavaScriptCore (JSC) has a new sampling profiler that powers Web Inspector’s JavaScript & Events timeline. The sampling profiler is a replacement of JSC’s old tracing profiler. It provides more accurate data about where time is spent in the executing program and is also an order of magnitude faster than the old tracing profiler. Tracing profilers work by inserting instrumentation into the running program. Sampling profilers, on the other hand, work by pausing the executing program at regular intervals and collecting data about the program’s execution state. When recording a timeline in Web Inspector today, you will experience a 30x speed improvement over the old timeline. This speedup is derived by two fundamental architecture changes made by JSC and Web Inspector when recording a timeline. The primary speedup comes from replacing the tracing profiler with the sampling profiler. Further speedup comes from removing debugging instrumentation from the executing program. JSC inserts debugging instrumentation into the executing program to support the debugger when Web Inspector is open. This instrumentation allows JSC to detect when a breakpoint has been hit in the executing program. However, this debugging instrumentation is not needed when recording a timeline; and by removing it, JSC will execute JavaScript 2x faster.
Profiling Methods
Tracing profilers are often less accurate for doing performance analysis because the high overhead of inserting instrumentation into the program changes the distribution of where time is spent in the executing program. For example, in JSC’s tracing profiler, each call site is decorated with a bytecode instruction both before and after the call to time how long each call takes. Tracing profilers are good for other forms of analysis though. For example, they can be used to construct a lossless dynamic call graph.
Sampling profilers operate by periodically sampling the target thread and collecting interesting data about its execution state. Often, the data collected will be a stack trace of the thread while it is paused. In JSC, the sampling profiler works without inserting any instrumentation into the running program. This is crucial in keeping the overhead of the sampling profiler low. A sampling profiler’s collected data set will always be lossy because it is sampling the executing thread at a fixed interval. It will never be able to reconstruct a lossless call graph of the executing program. That said, sampling profilers are more accurate than tracing profilers at determining where time is spent in the executing program. There are two main reasons for this. First, sampling profilers are low overhead which makes them good at observing the program in its natural state. Second, if a certain part of the program is hot, there is a high probability that the sampling profiler will take a sample while the hot portion of the program is executing. Put another way, the probability of not sampling the hot portions of the program is very low.
It’s imperative that a sampling profiler contains as little bias as possible as to where in the program’s execution state it samples. If there is bias in where data samples are taken, the data set will not be representative of the natural execution state of the program. For example, some profilers are implemented using safepoints. Safepoints are specific places in the program where the executing thread is yielding its execution to allow other tasks to run. Often, safepoints are used for GC and provide strict guarantees about the state of the executing thread when it enters the safepoint. One way to implement a sampling profiler in JSC would be to use a safepoint-based mechanism. JSC would compile a safepoint at each function prologue and at each loop header. As Mytkowicz, Diwan, Hauswirth, and Sweeney show, safepoint-based profilers are not accurate. They introduce too much bias into the measured data set. In JSC, a safepoint based implementation would also suffer from being biased. Crucially, it would prevent the profiler from knowing when the executing code enters the C runtime. For some programs, much of the program’s time is spent in JavaScript functions that call into the C runtime. It’s necessary to attribute the time spent in the C runtime to the JavaScript frame that called into it. For JSC to use a safepoint-based implementation, the C runtime would need to learn how to interface with the profiler. This would both be error prone and cumbersome. Safepoint-based profilers are continually playing a cat and mouse game to minimize bias. Once a part of the engine that has bias is exposed, the profiler must remove that bias by teaching that part of the engine about the profiler.
JSC does not use a safepoint-based profiler because of these downfalls. The design JSC implemented is simpler and cleaner because instead of teaching different parts of the engine about the profiler, JSC taught the profiler about the different parts of the engine. This turns out to be much simpler than using safepoints because teaching the profiler about the engine requires very little work. JSC’s profiler works by using a background sampling thread that wakes up at a given frequency, pauses the JSC execution thread, and takes a conservative stack trace. This design also naturally leads to a profiler that is both more accurate and has lower overhead than a profiler implemented using safepoints.
Implementing JSC’s Sampling Profiler
JSC’s sampling profiler must take a conservative stack trace. The sampling thread doesn’t know beforehand what state the executing thread will be in when it gets paused (JSC doesn’t’ use safepoints, after all). The executing thread may be in a state where it’s not possible to take a stack trace. If the sampling thread encounters such a state, it will go back to sleep, and try again on the next sample. This can be cause for concern. Not being able to take a stack trace at certain points in the program can lead to bias in the data set if the places where a stack trace can’t be taken is where the program is spending a lot of its time. However, the places where this is a problem are limited. They happen at very specific regions of machine code that JSC generates. The most common place is at certain instruction sequences in JSC’s calling convention code. Because JSC is in control of the code it generates, it’s able to limit the effect of such biases. When JSC engineers find such biases, they can try to minimize their impact by structuring the machine code in such a way that both creates fewer and smaller regions where taking a stack trace is not possible.
Because the sampling profiler is cleanly separated from other parts of the VM, its implementation is quite simple. The rest of this section will investigate the more interesting implementation details in JSC’s sampling profiler. To explore these details, let’s first analyze a high-level pseudocode implementation of JSC’s sampling profiler algorithm:
void SamplingProfiler::startSampling()
{
    VM& vm = getCurrentVM();
    MachineThread* jscThread = getJSCExecutionThread();

    while (true) {

        std::sleep_for(std::chrono::microseconds(1000));

        if (vm.isIdle())
            continue;

        // Note that the sampling thread doesn't control the state in
        // which the execution thread pauses. This means it can be holding
        // arbitrary locks such as the malloc lock when it gets paused.
        // Therefore, the sampling thread can't malloc until the execution
        // is resumed or the sampling thread may deadlock.
        jscThread->pause();

        // Get interesting register values from the paused execution thread.
        void* machinePC = thread->PC();
        void* machineFramePointer = thread->framePointer();
        // JSC designates a machine register to hold the bytecode PC when
        // executing interpreter code. This register is only used when the
        // sampling thread pauses the top frame inside the interpreter.
        void* interpreterPC = thread->interpreterPC();

        void* framePointer = machineFramePointer;
        if (!isMachinePCInsideJITCode(machinePC)
            && !isMachinePCInsideTheInterpreter(machinePC)) {
            // When JSC's JIT code calls back into the C runtime, it will
            // store the frame pointer for the current JavaScript upon
            // entry into the runtime. This is needed for many reasons.
            // Because JSC does this, the sampling profiler can use that frame
            // as the top frame in a stack trace.
            framePointer = vm.topCallFrame;
        }

        bool success =
            takeConservativeStackTrace(framePointer, machinePC, interpreterPC);

        if (!success)
            continue;

        jscThread->resume();

        // The sampling thread can now malloc and do interesting things with
        // other locks again.
        completeStackTrace();
    }
}
The actual implementation is only slightly more complicated than the above pseudocode. Because the sampling thread doesn’t control the state in which the JSC execution thread gets paused, the sampling thread can’t assume anything about which locks the execution thread holds. This means that if the sampling thread wants to guarantee that the execution thread doesn’t hold a particular lock before it gets paused, the sampling thread must acquire the lock prior to pausing the execution thread. There are other locks, though, that the sampling thread doesn’t want to acquire and that it makes sure aren’t acquired transitively while the execution thread is paused. The most interesting lock in this category is the malloc lock. The conservative stack trace that the sampling thread takes must not malloc any memory. If the sampling thread were to malloc memory, it would cause a deadlock if the execution thread were holding the malloc lock while it was paused. To prevent mallocing any memory, the sampling thread pre-allocates a buffer for the conservative stack trace to place its data. If it runs out of space in that buffer, it will end its stack trace early and it will grow its buffer after it resumes the execution thread.
The sampling profiler must be aware of where the machine’s program counter (PC) is when the execution thread is paused. There are four states that the sampling thread cares about. The first state is when the VM is idle; when encountering this state, the sampling thread just goes back to sleep. The last three are based on the machine’s PC when the VM is not idle. The PC can be inside JIT code, inside interpreter code, or neither. The sampling thread takes that last state to mean that the PC is inside the C runtime. The sampling thread is able to easily determine when the execution thread is inside the C runtime and attribute that time to the JavaScript caller into the C runtime. The sampling thread can do this by reading a field off the VM class which holds the frame pointer for the JavaScript frame that called into the C runtime. This prevents JSC’s sampling profiler implementation from suffering from one of the biggest downsides of the hypothetical safepoint-based implementation. The reason that the sampling thread must distinguish between the interpreter and JIT code is that the interpreter uses a virtual PC to hold the current bytecode instruction that’s being executed. The sampling thread uses the interpreter’s virtual PC to determine where in the function the program is executing. The machine PC does not hold enough information to do that inside an interpreter. When the machine PC is inside JIT code, JSC uses a mapping from PC to what JSC calls CodeOrigin. A CodeOrigin is used to determine the line and column number of the current operation that the program is executing.
Making JSC Fast When Sampling
With the tracing profiler, Web Inspector would always enable JSC’s debugger even when it was recording a timeline. Enabling the debugger prevents many interesting compiler optimizations from taking place. For example, JSC disables inlining. JSC also marks all variables as closure variables. This forces some variables that would have otherwise lived on the stack to live in a heap allocated closure object, making all uses of that variable a read from the heap, and all writes to that variable a write into the heap. Also, all functions must do at least one object allocation for the closure object. Because the debugger drastically changes the executing state of the program, it biases the executing program away from its natural state. Also, the tracing profiler wasn’t implemented in JSC’s FTL JIT. Because of these shortcomings, the data recorded with the tracing profiler can be skewed at best, and completely wrong at worst.
To prevent these same biases with the sampling profiler, Web Inspector disables JSC’s debugger before starting a timeline recording. To make the timeline recording reflect the natural execution state of the program, JSC can’t be sampling a program that was compiled with debugging instrumentation. Unlike the tracing profiler, the sampling profiler doesn’t restrict which compiler tiers functions are allowed to execute in. The sampling profiler can take a stack trace with any frame in the stack being compiled under any tier. By removing these shortcomings, when using the sampling profiler in Web Inspector when recording a timeline, JSC both has great performance and also collects data that is more representative of the natural execution state of the program.
To see how much more accurate the sampling profiler can be than the tracing profiler, let’s examine a program in which the tracing profiler’s data set indicates that significant time is spent in a particular function when the program in its natural state will spend little time in that function:
var shouldComputeSin = false;
var shouldComputeCos = true;

function computeSin(obj, x) {
    if (shouldComputeSin)
        obj.sin = Math.sin(x);
}

function computeCos(obj, x) {
    if (shouldComputeCos)
        obj.cos = Math.cos(x);
}

function computeResults(x) {
    var results = {};
    computeSin(results, x);
    computeCos(results, x);
}

function run() {
    for (var i = 0; i < 1000000; i++) {
        computeResults(i);
    }
}
run();
When running the example program in JSC in its natural state, JSC will perform the following important optimizations that will remove most of the overhead of the program:
- The calls to
computeSinandcomputeCoswill be inlined intocomputeResults. - The branches on
shouldComputeSinandshouldComputeCoswill be constant folded because JSC will realize that these variables are global and have been constant within the execution of the program. - When
computeResultstiers up to the FTL, the FTL will perform object allocation sinking which will preventcomputeResultsfrom performing an allocation for theresultsobject. The FTL can do this because after it has inlinedcomputeSinandcomputeCos, it proves thatresultsis only used locally and doesn’t escape. Allocation sinking will then transformresults‘s fields into local variables.
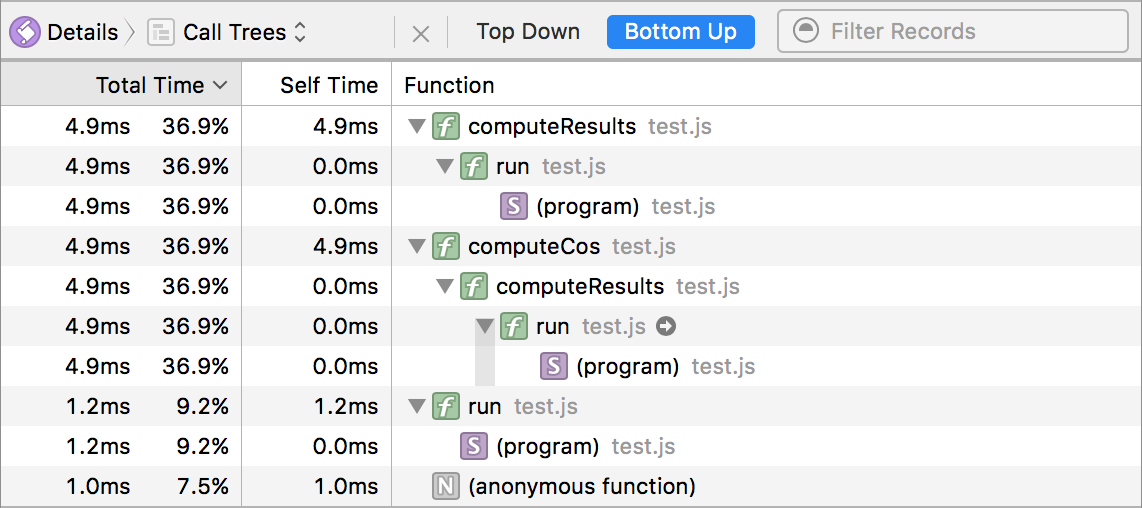
The example program runs super fast when recording a timeline in Web Inspector in Safari Technology Preview; it executes in about 10ms on my machine. The sampling profiler shows the following distribution of where time is spent:
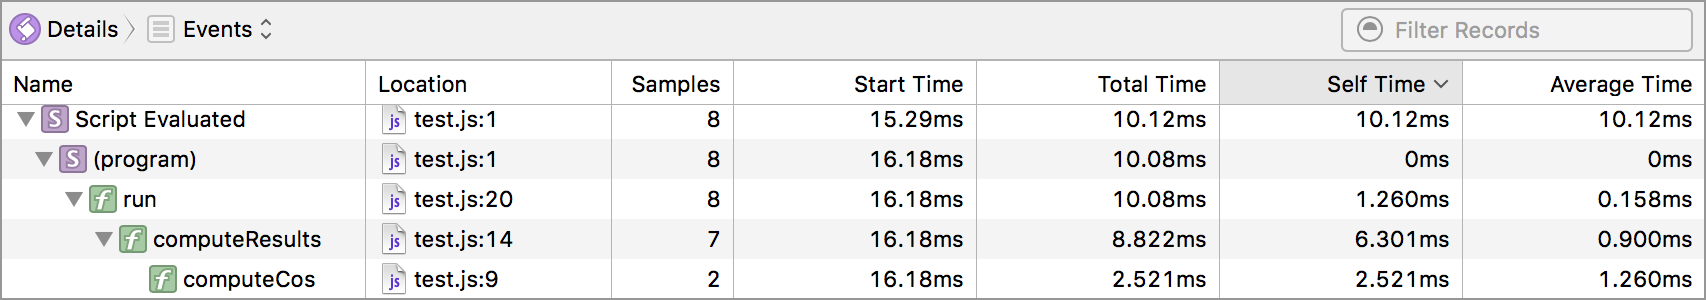
Time is only spent inside computeResults and computeCos; no time is spent in computeSin. This makes sense because once computeResults tiers up to the optimizing JITs, JSC will perform optimizations that will make computeSin turn into a no-op.
When recording a timeline of the same program inside Safari 9, the results are completely different:
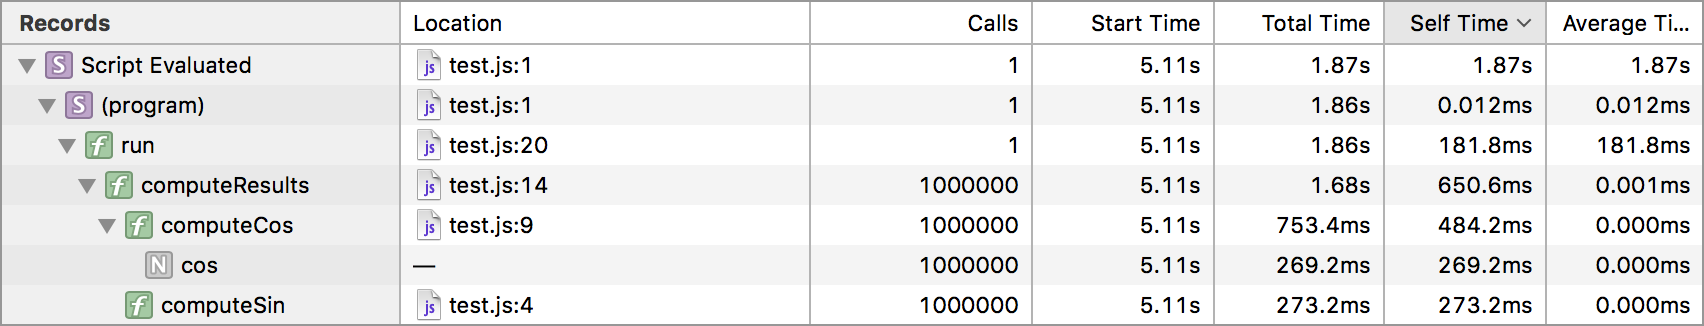
The tracing profiler measures that the program runs in about 1.85 seconds. That’s 185x slower than what the sampling profiler measured inside Safari Technology Preview. Also, when looking at the call tree for the tracing profiler, the data shows that a significant amount of time was spent inside computeSin. This is just wrong. When the program runs in its natural, unobserved state, effectively no time is spent inside computeSin. It’s imperative for a profiler to report accurate information for programs like the example above. When a profiling tool reports misleading data, it causes users of the tool to spend time optimizing the wrong thing. If a user were to trust the tracing profiler’s data for this example, it might lead them to remove the function calls from computeResults and to manually inline computeSin and computeCos into computeResults. However, the sampling profiler shows that this isn’t necessary because JSC will perform this optimization on its own inside the DFG and FTL JITs.
To compare the performance of both profilers on a more realistic workload, let’s examine their performance on the Octane benchmark:
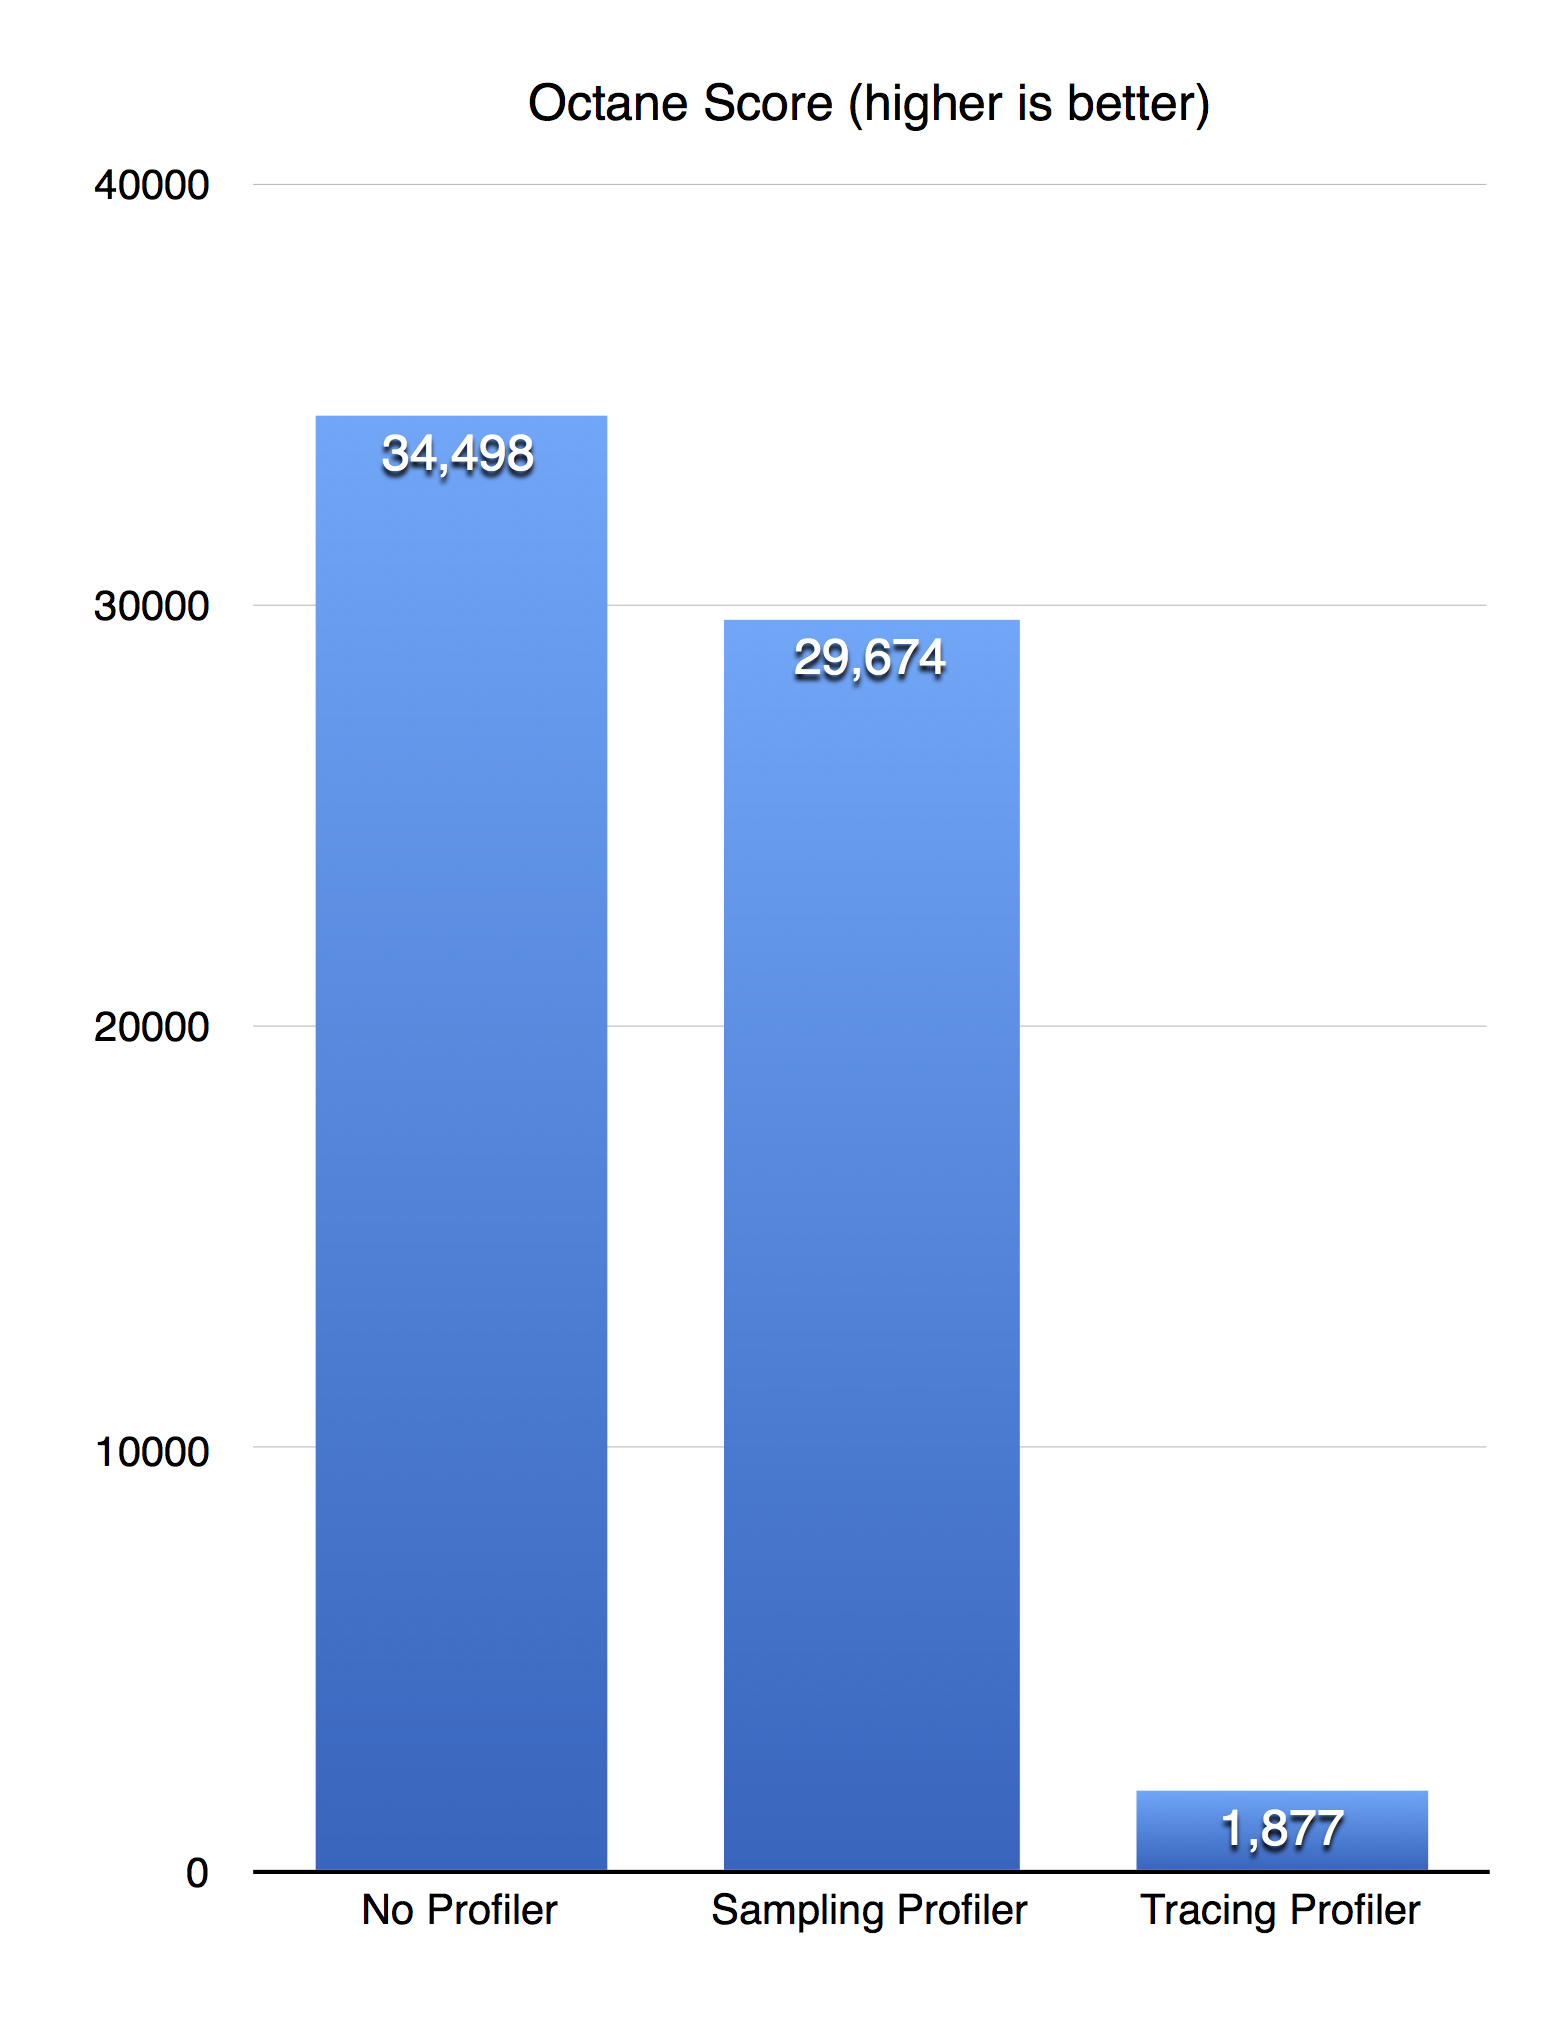
To gather this data, I wanted to run Octane in the browser both with Safari Technology Preview and Safari 9 while recording a timeline in Web Inspector. Unfortunately, Safari 9 crashes when recording a timeline while running Octane. So not only is the sampling profiler much faster, it’s also more reliable. To get Octane to run without crashing, I ran it using the jsc command line utility and used the necessary jsc command line options to simulate what recording a timeline in Safari Technology Preview with the sampling profiler is like and what recording a timeline in Safari 9 using the tracing profiler is like. These results clearly show that Web Inspector and JSC are an order of magnitude faster with the new profiling architecture than the old tracing profiling architecture.
Web Inspector Integration
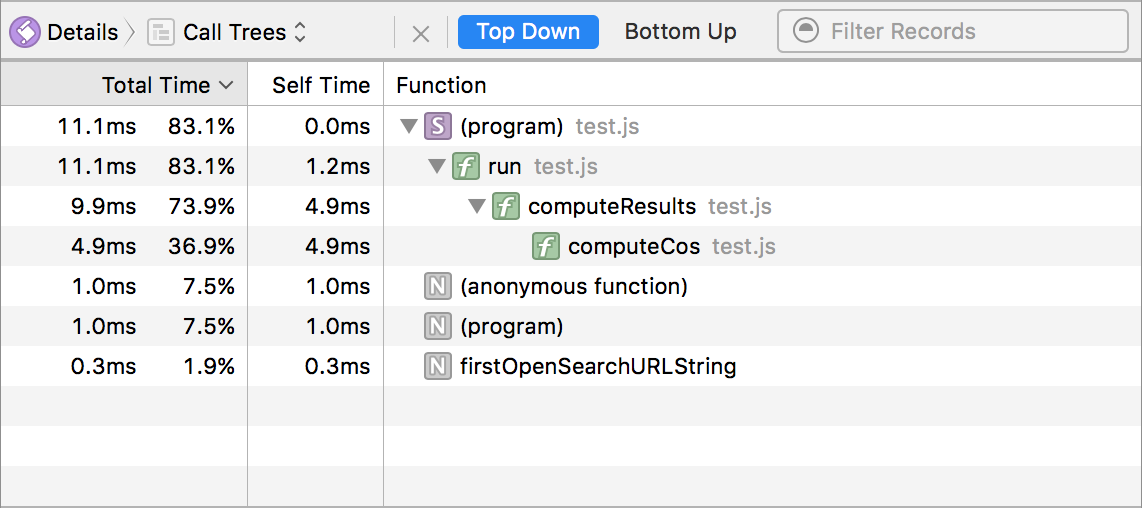
To compliment the new sampling profiler, Web Inspector has introduced a new Call Trees view inside the JavaScript & Events timeline. This view allows users to view compact call tree data about the entire program or hand selected time ranges. The call tree can be viewed Top Down or Bottom Up (which is my favorite view for doing performance analysis). Here are two images showing the new Call Trees view for the above example JavaScript program.
Summary
There were many changes made to JSC and Web Inspector to make the new sampling profiler both fast and accurate. The accuracy of the new profiler is a product of removing all instrumentation in the executing program. JSC moved to using a sampling profiler instead of a tracing profiler because sampling profilers don’t need to compile instrumentation into the executing program. Sampling profilers are also more accurate for doing performance analysis because they introduce less bias into the measured data set than tracing profilers. Also, Web Inspector now disables the debugger when recording a timline to prevent debugging instrumentation being compiled into the JavaScript program. Together, these changes make the new JavaScript & Events timeline a great experience for doing performance analysis work by making JavaScript run 30x faster than it used to. If you have any comments or questions regarding JSC’s new sampling profiler, please get in touch with me or Jon Davis on Twitter.