JavaScript Debugging Improvements
Debugging JavaScript is a fundamental part of developing web applications. Having effective debugging tools makes you more productive by making it easier to investigate and diagnose issues when they arise. The ability to pause and step through JavaScript has always been a core feature of Web Inspector.
The JavaScript debugger hasn’t changed in a long time, but the Web and the JavaScript language have. We recently took at look at our debugger to see how we could improve the experience and make it even more useful for you.
Stepping
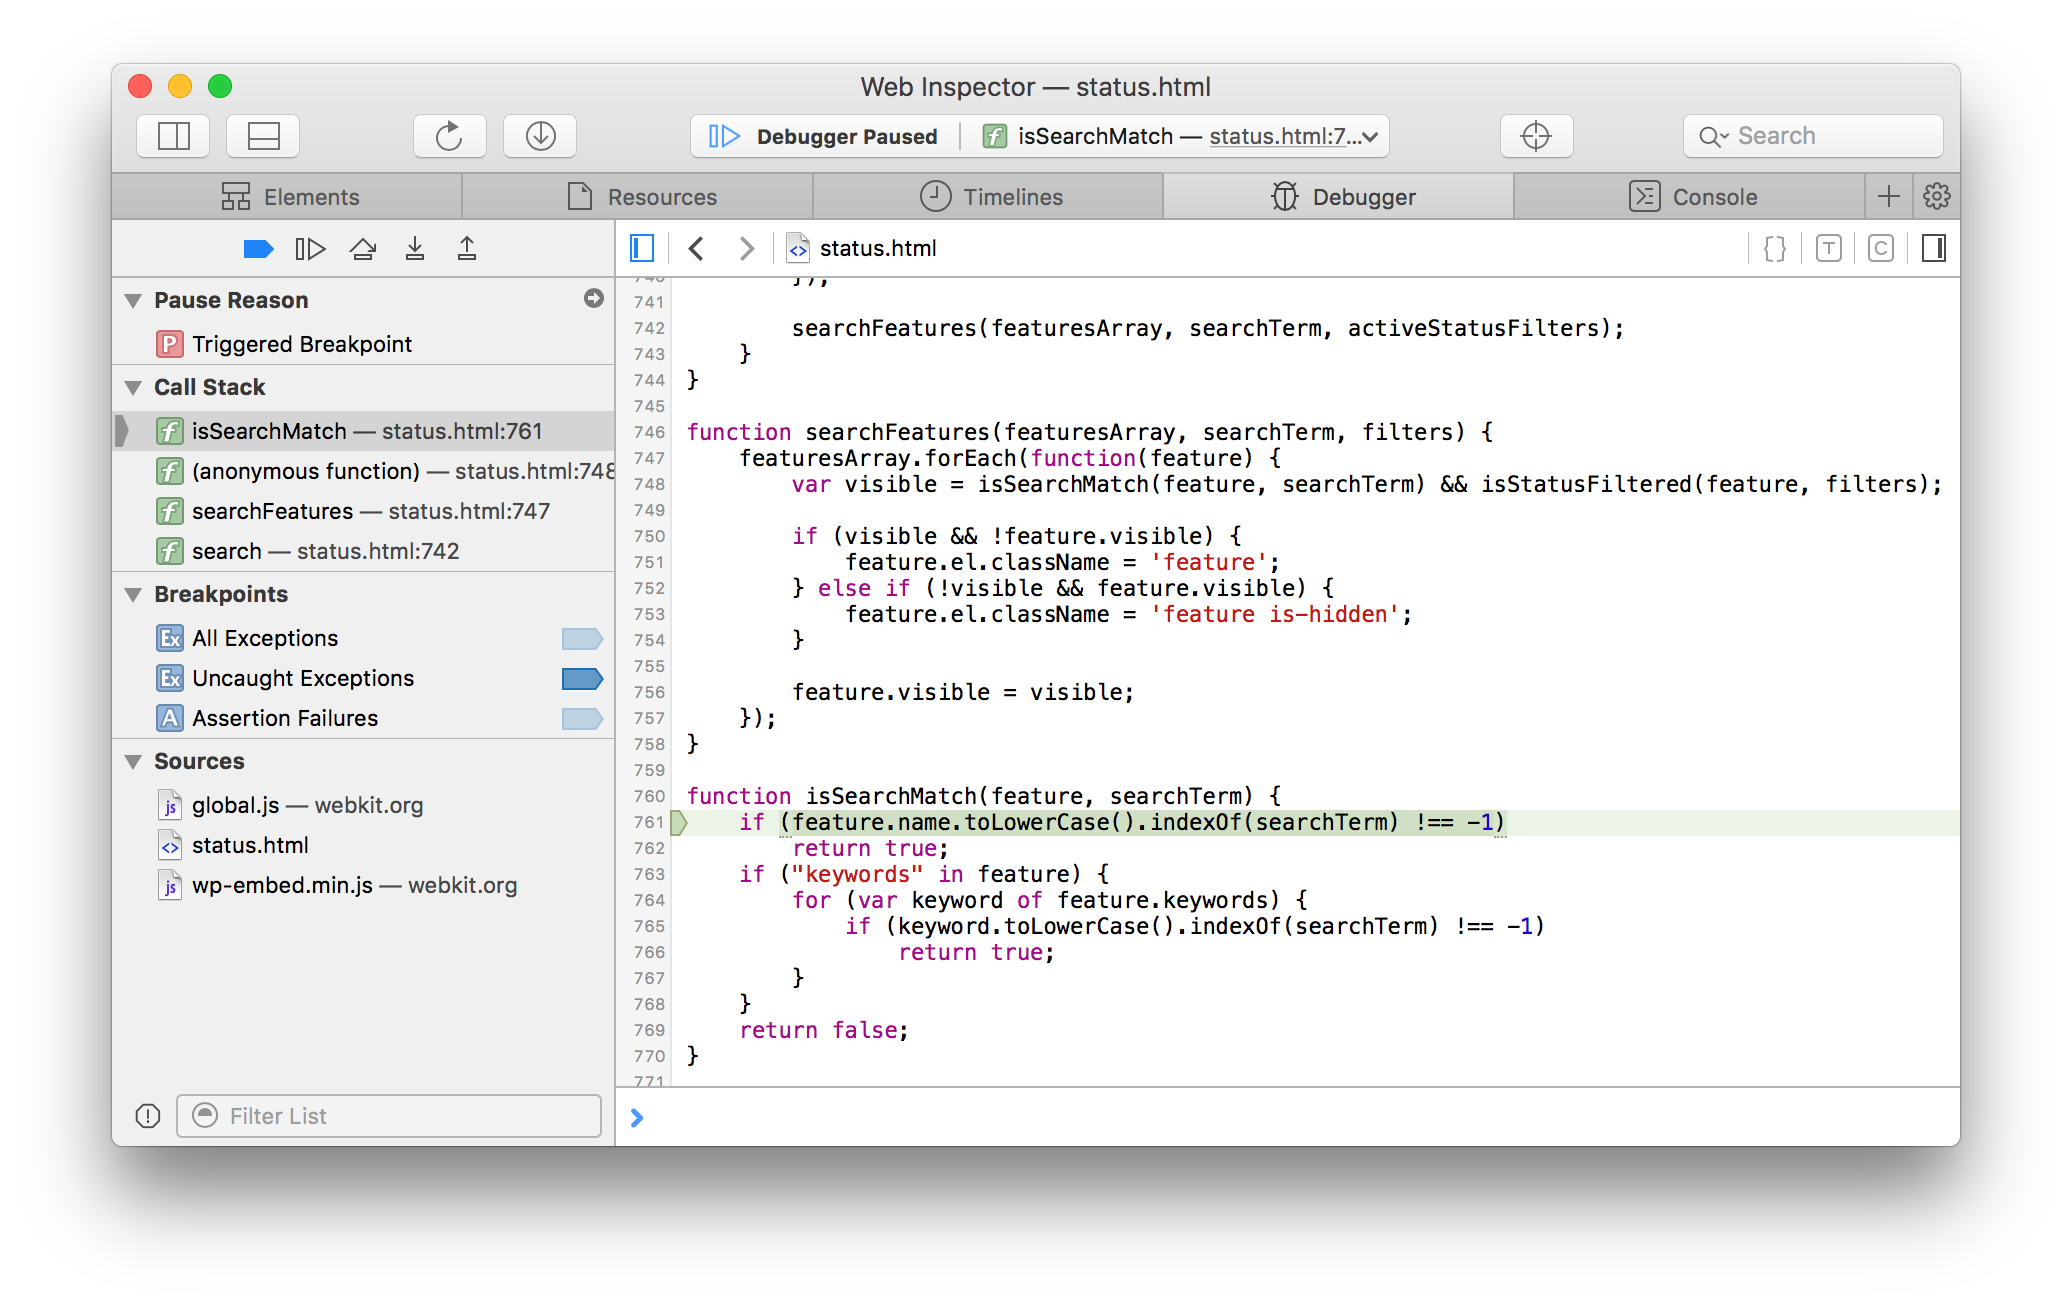
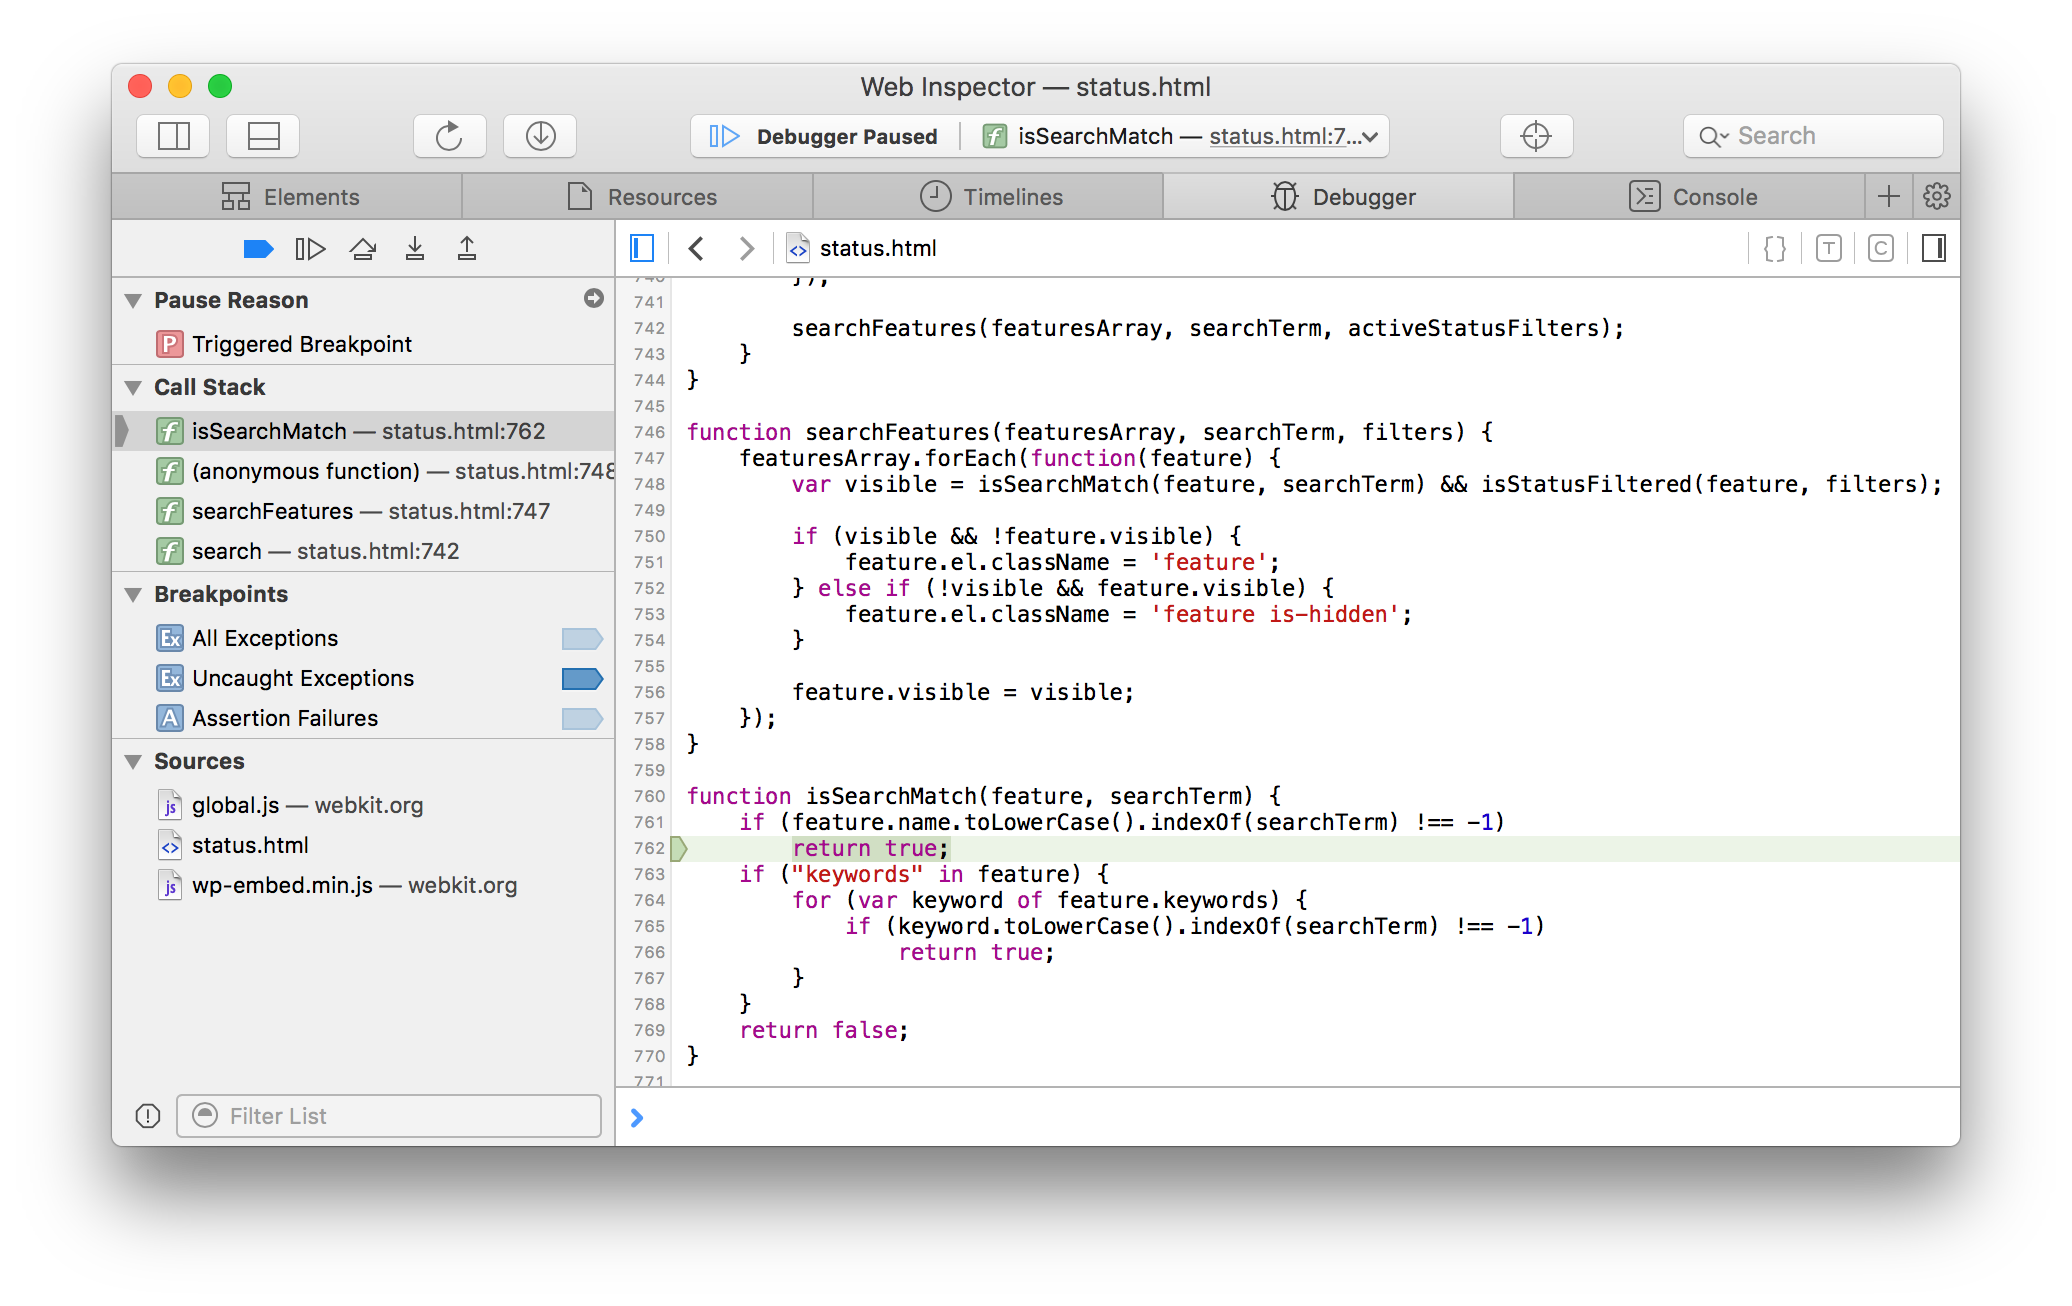
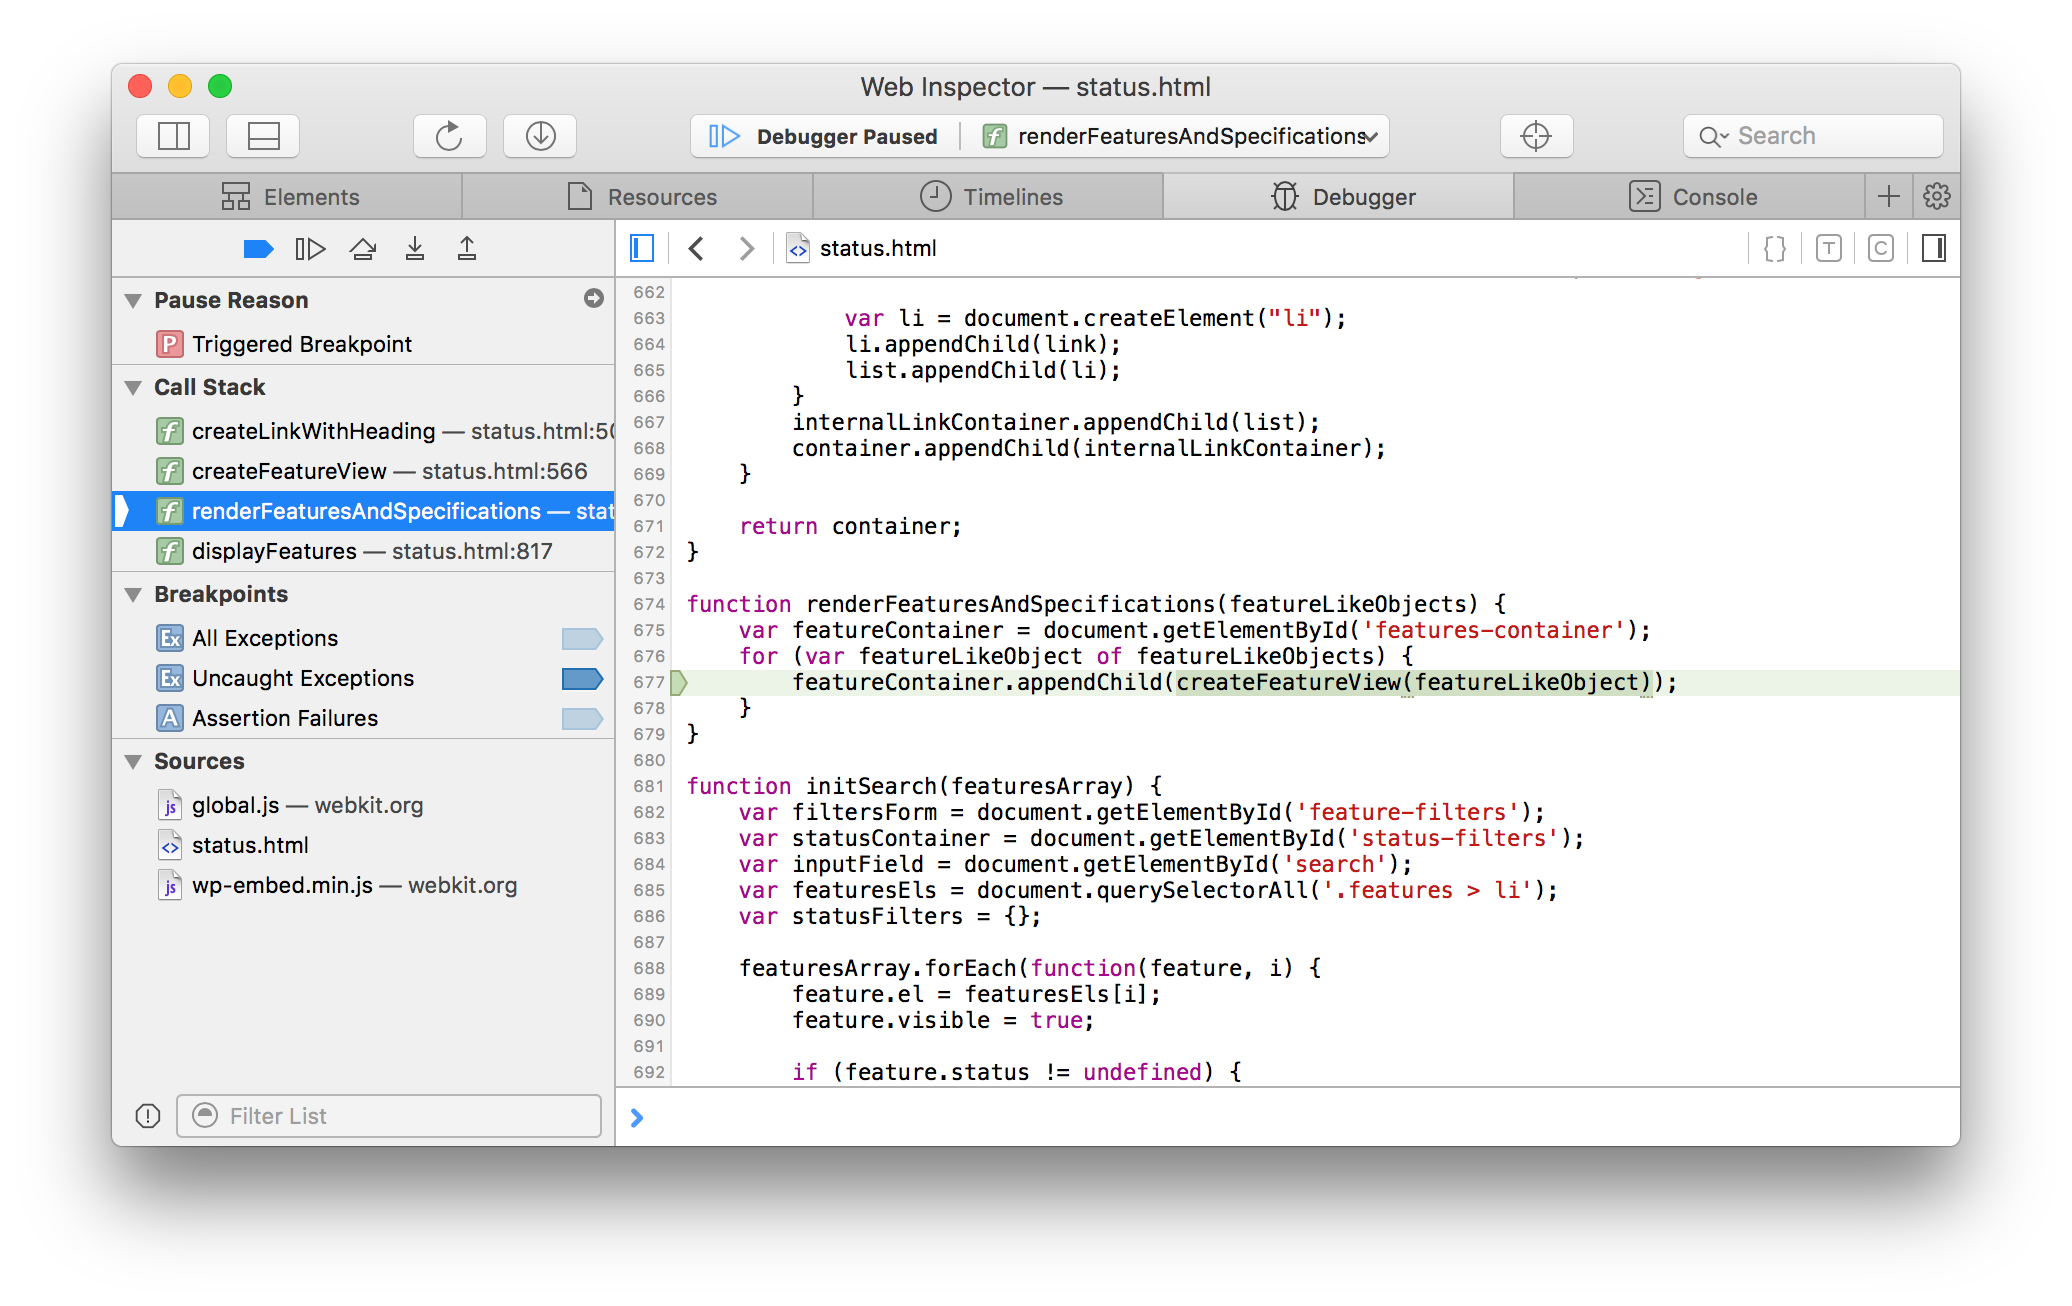
Web Inspector now includes extra highlights for the active statement or expression that is about to execute. For previous call frames, we highlight the expression that is currently executing.
Previously, Web Inspector would only highlight the line where the debugger was paused. However, knowing exactly where on the line the debugger was and therefore what was about to execute might not be obvious. By highlighting source text ranges of active expressions we eliminate any confusion and make stepping through code easier and faster.
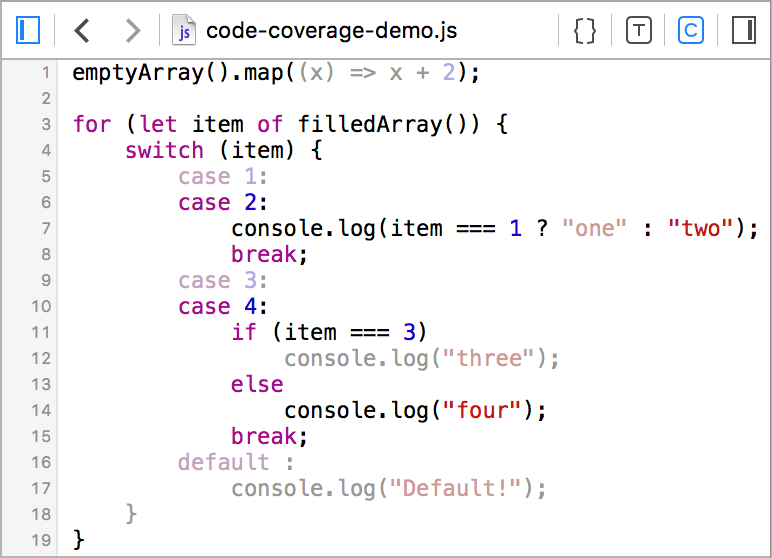
For example, when stepping through the following code it is always immediately clear what is about to execute, even when we are executing a small part of a larger statement:


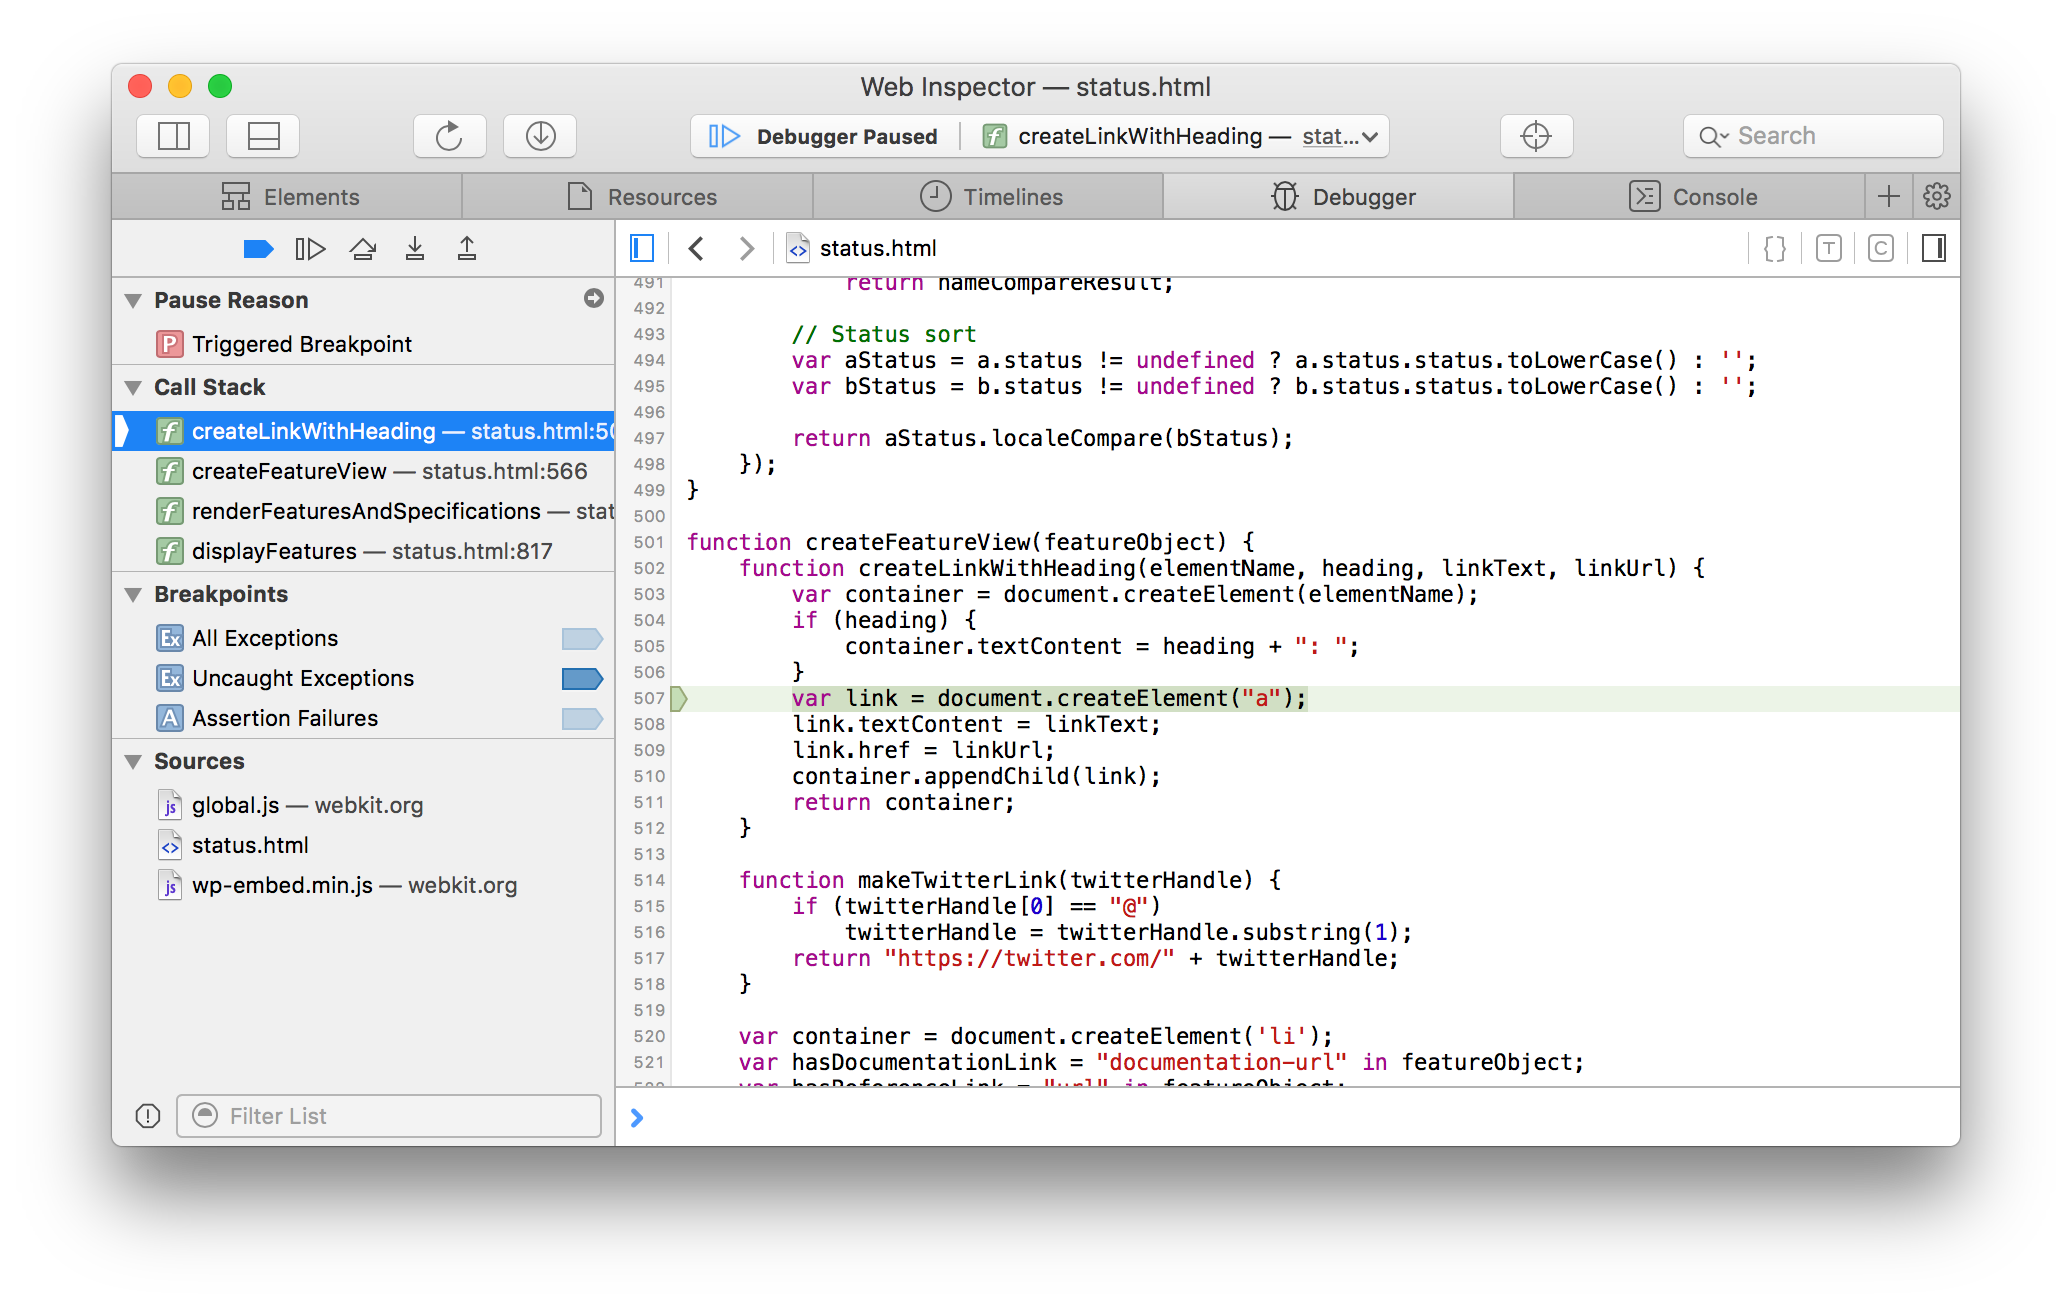
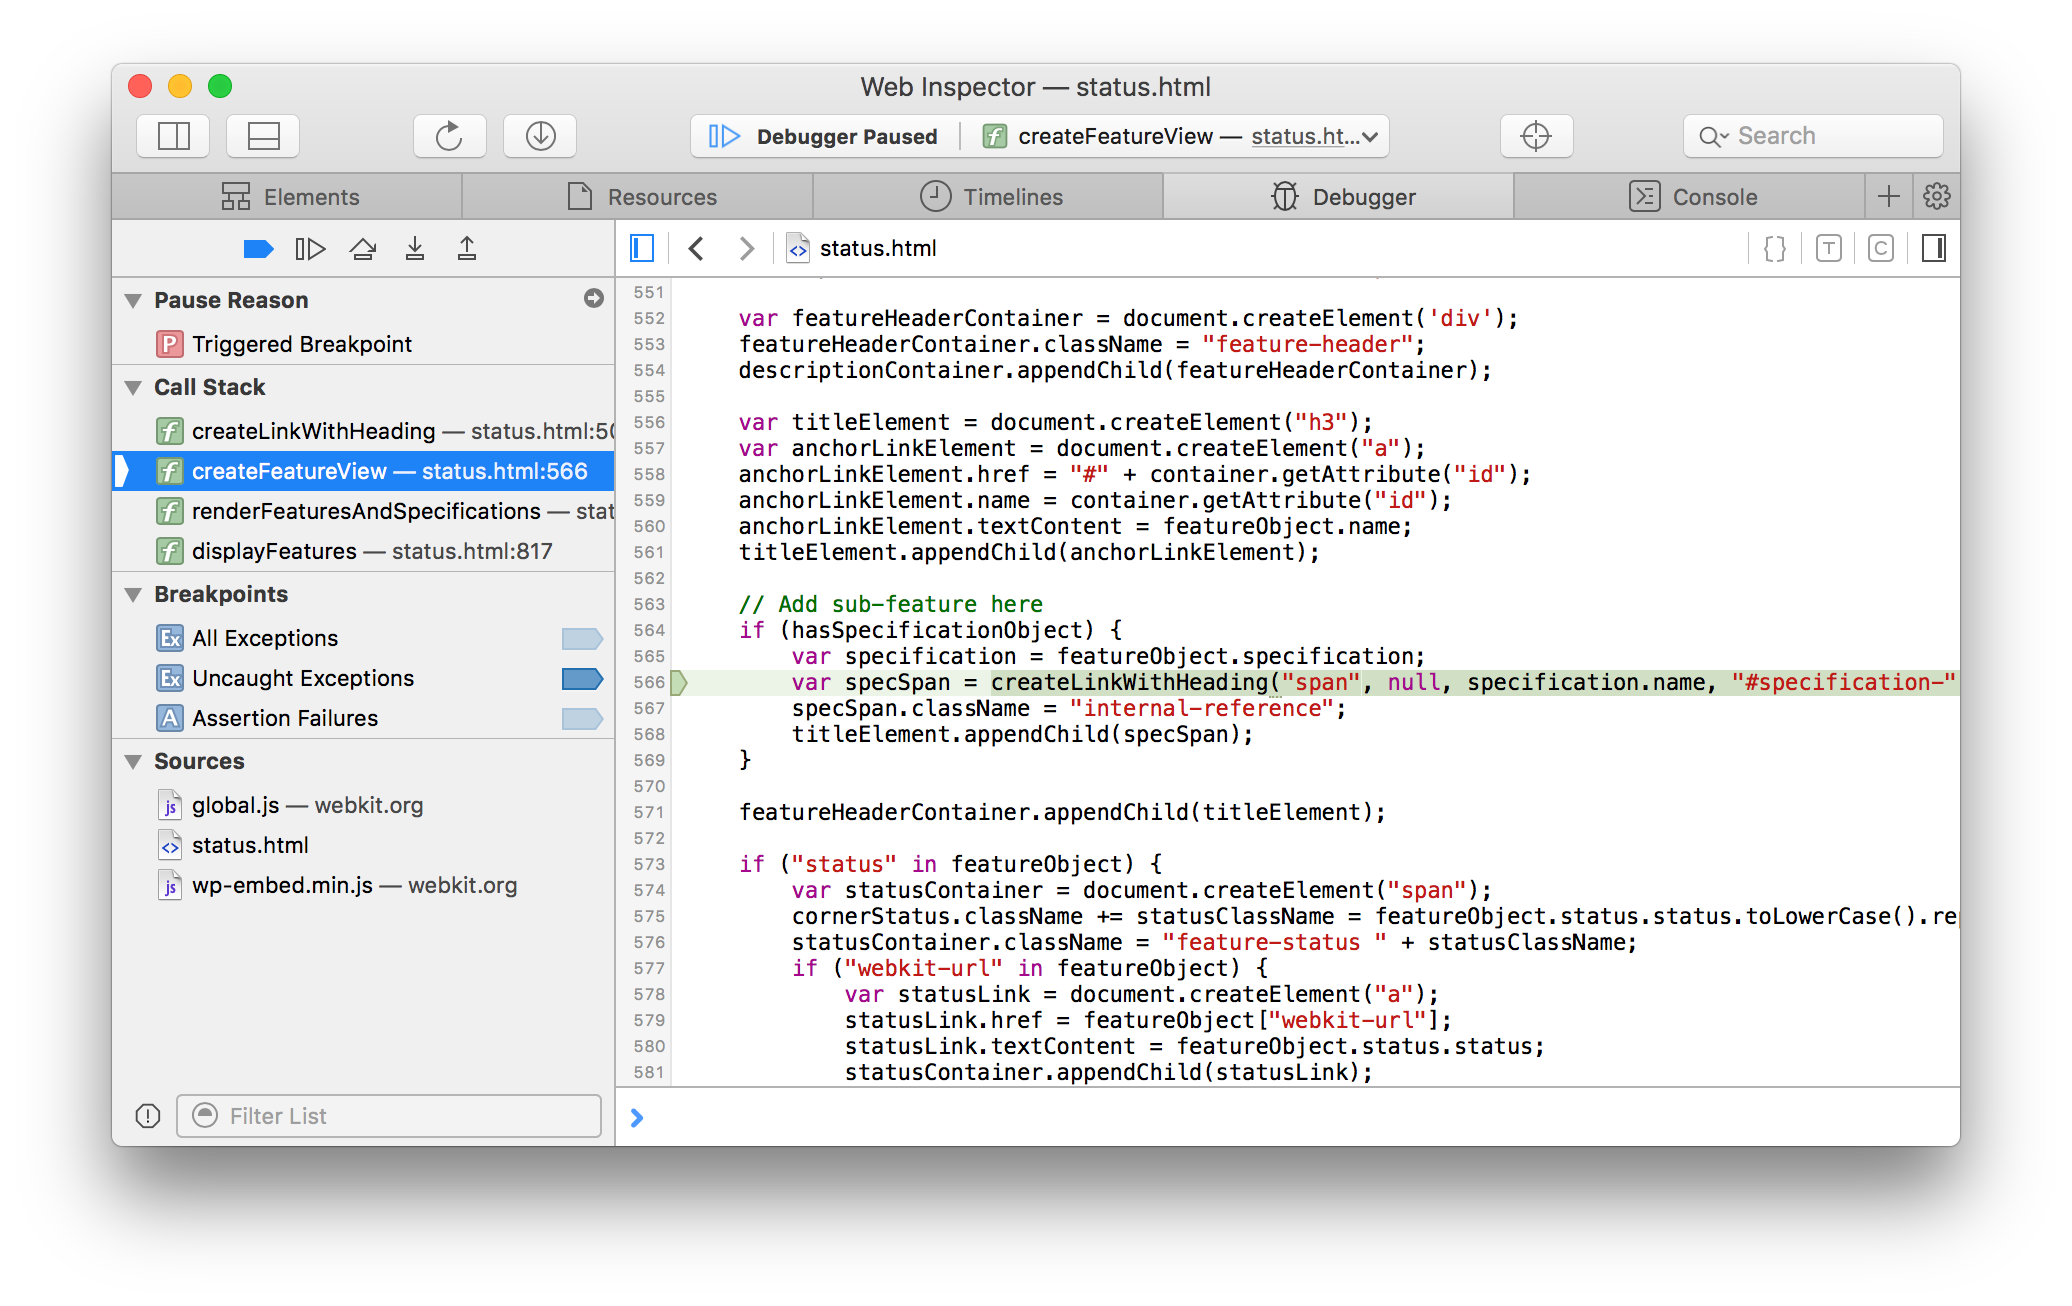
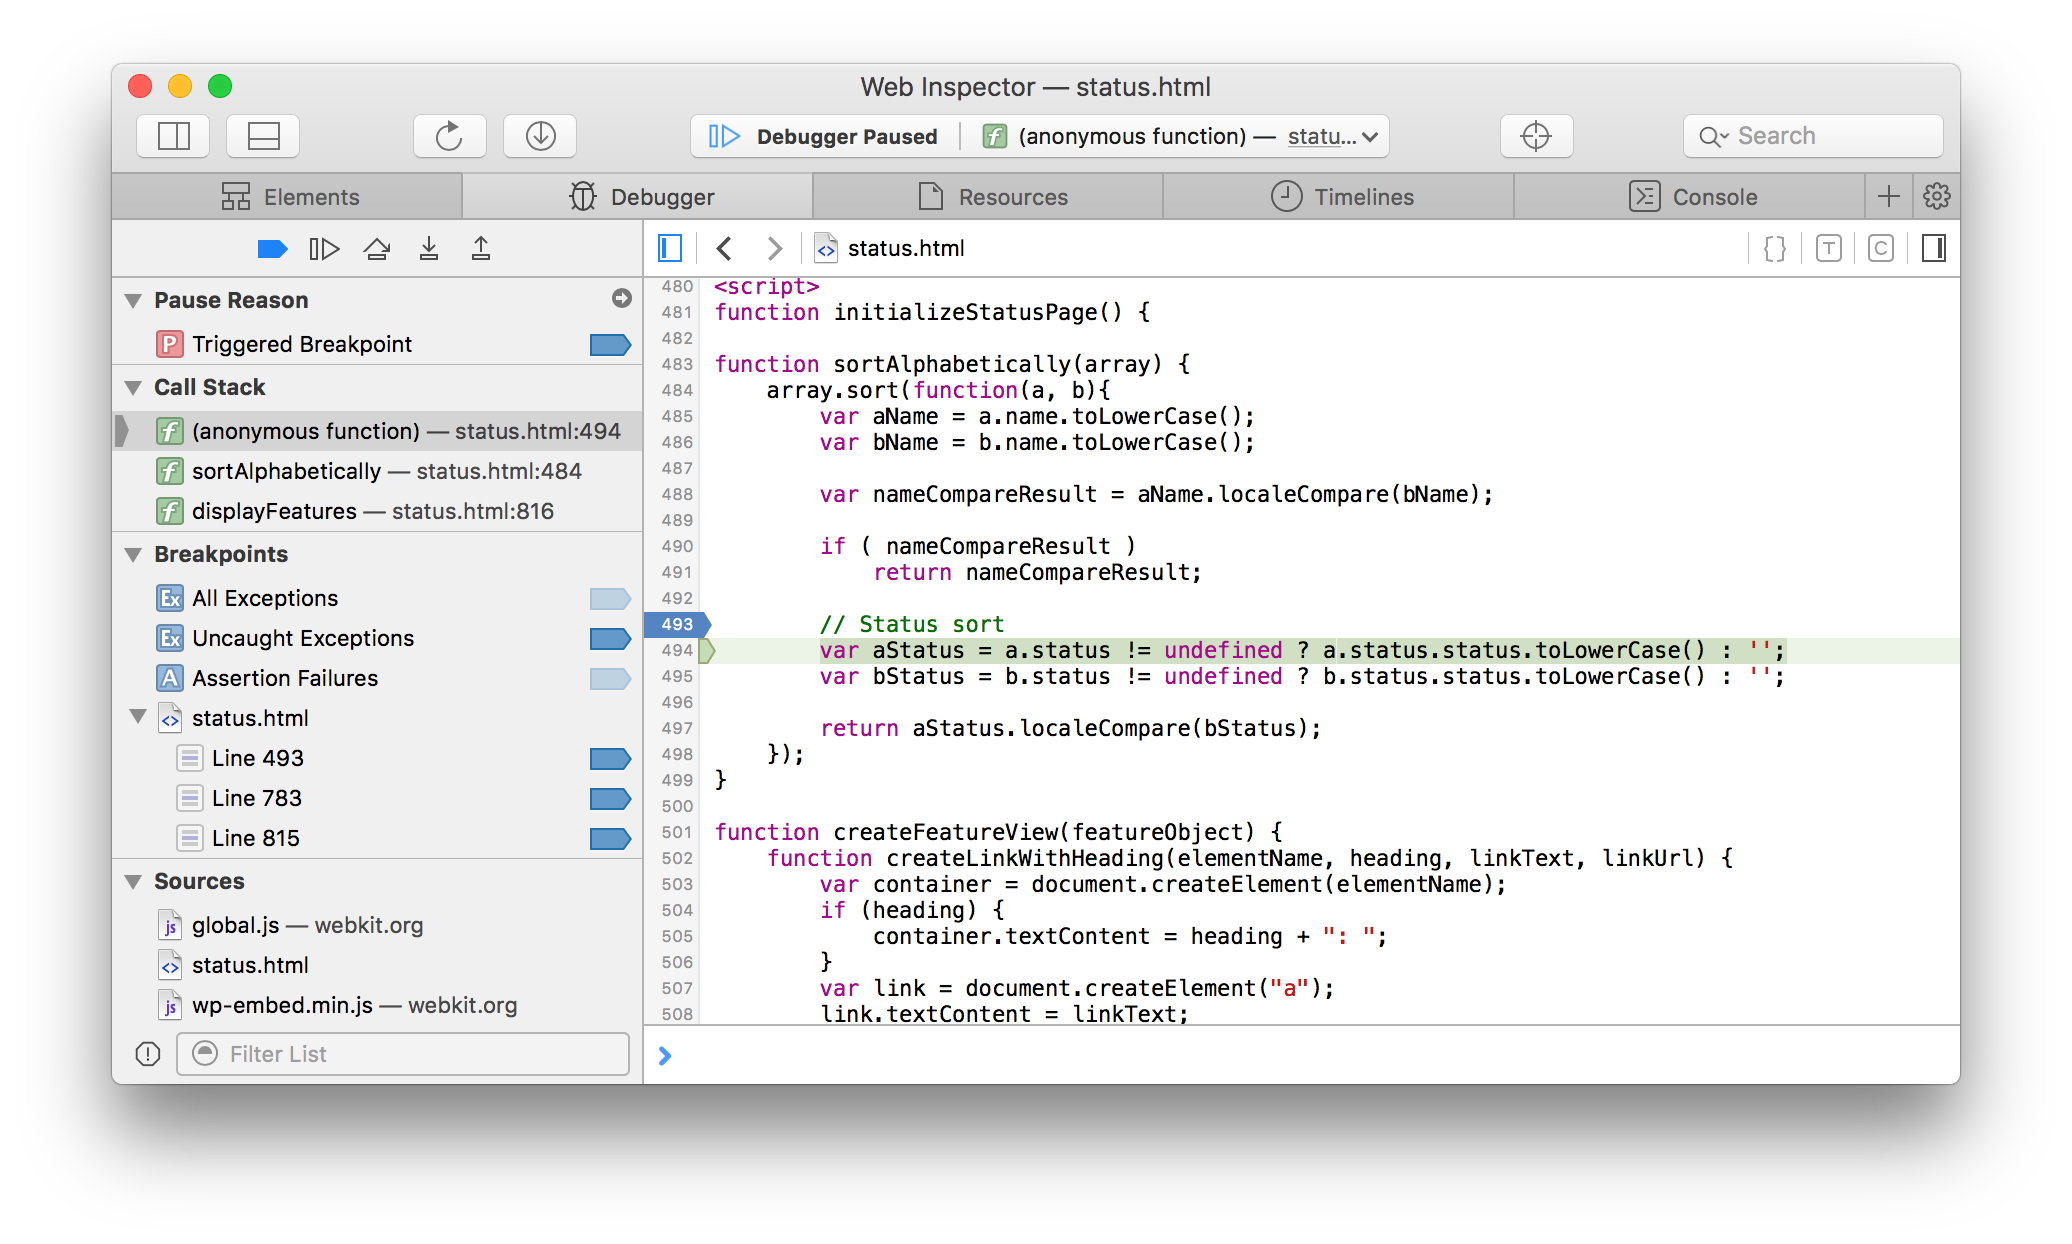
Highlighting expressions is also useful when looking at previous call frames in the Call Stack. Again, when selecting parent call frames it is always immediately clear where we are currently executing:

We also made improvements to the stepping behavior itself. We eliminated unnecessary pauses, added pause points that were previously missed, and generally made pausing locations more consistent between old and new syntaxes of the language. Stepping in and out of functions is also more intuitive. Combined with the new highlights stepping through complex code is now easier than ever.
Breakpoints
Web Inspector is now smarter and more forgiving about where it resolves breakpoints, making them more consistent and useful.
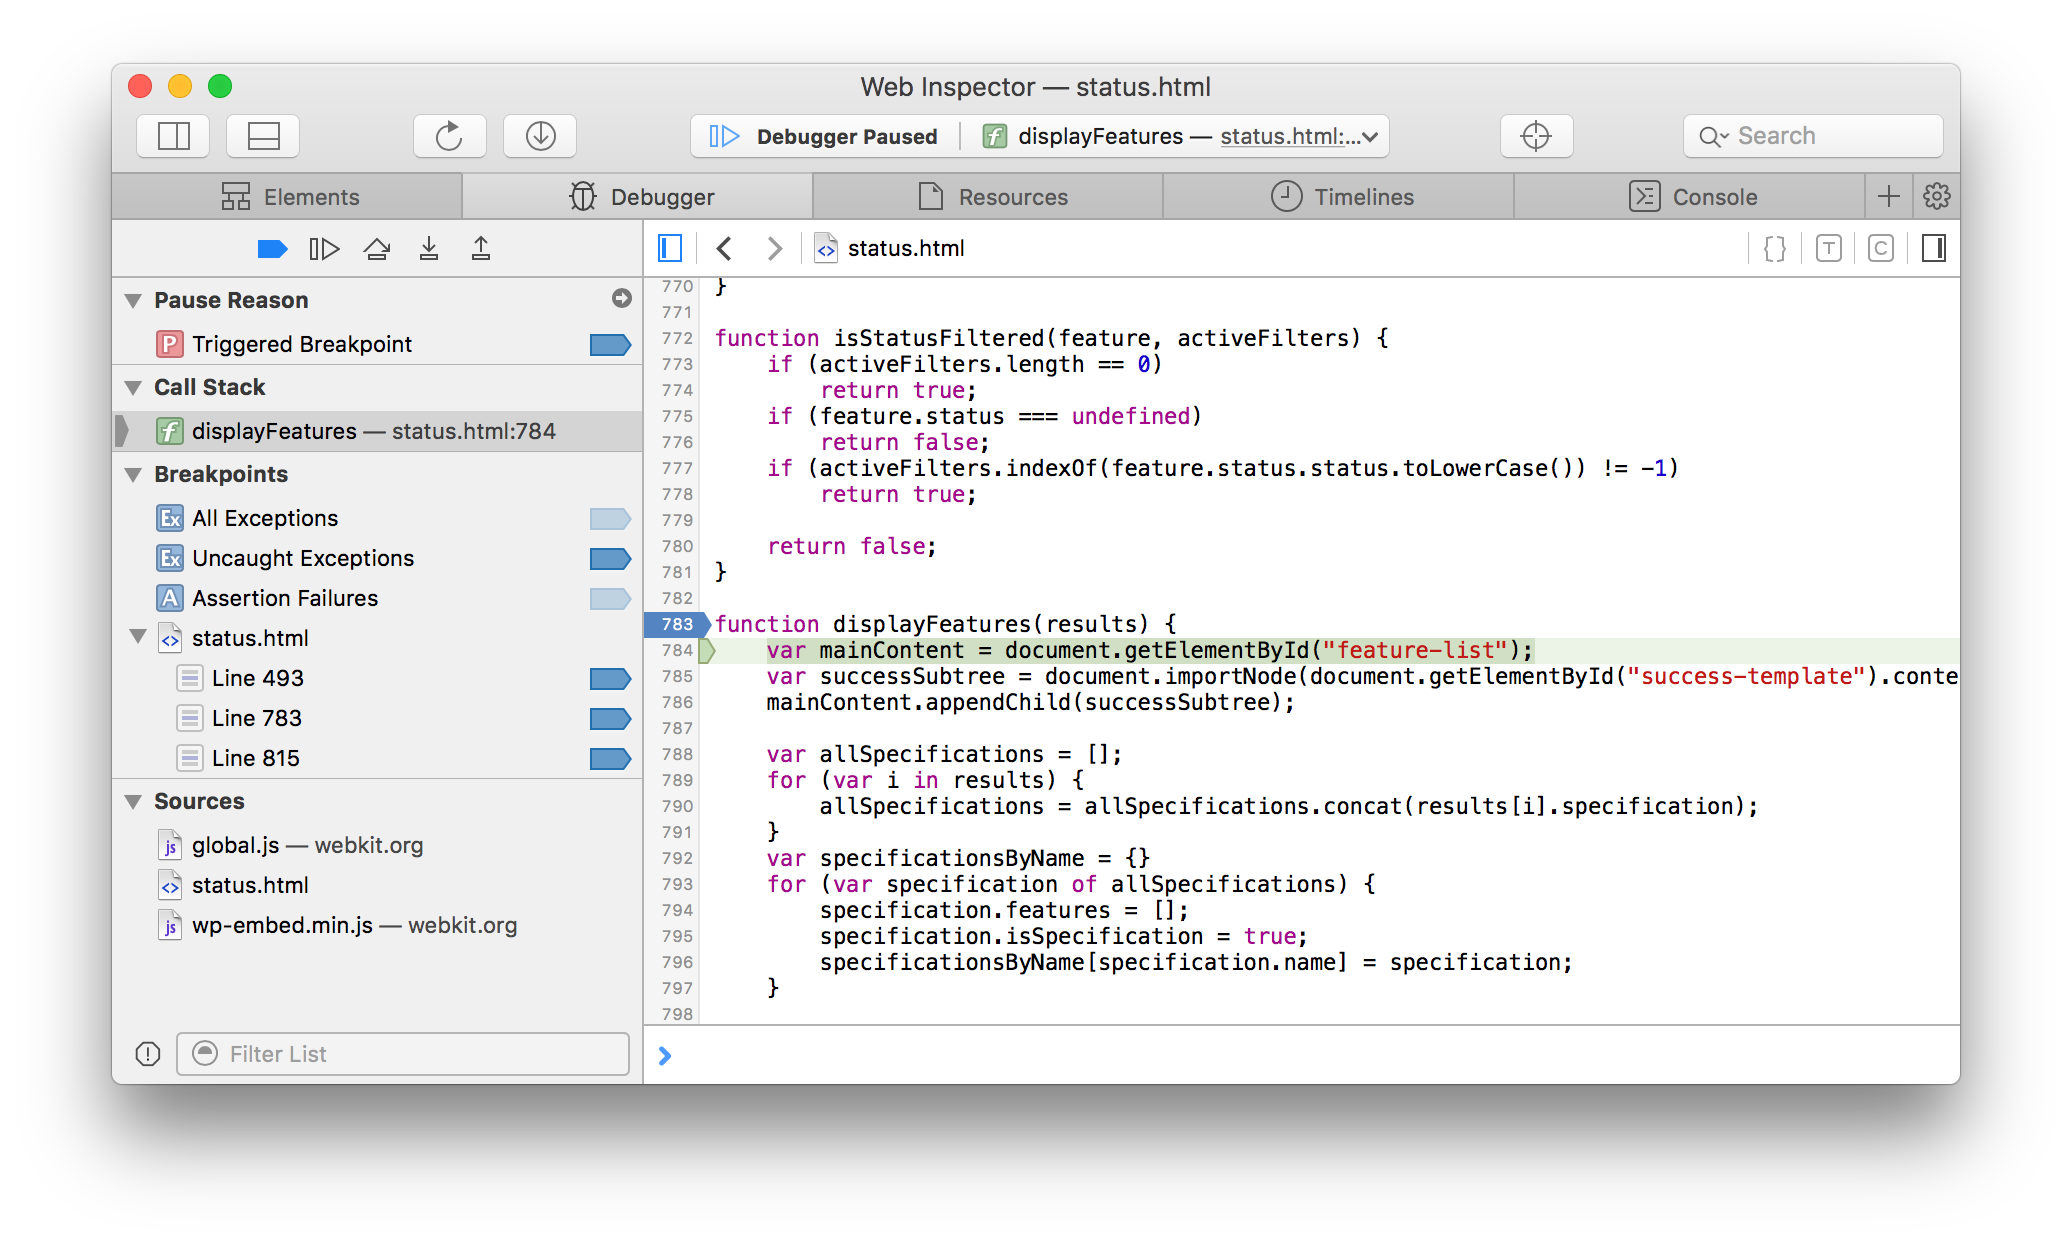
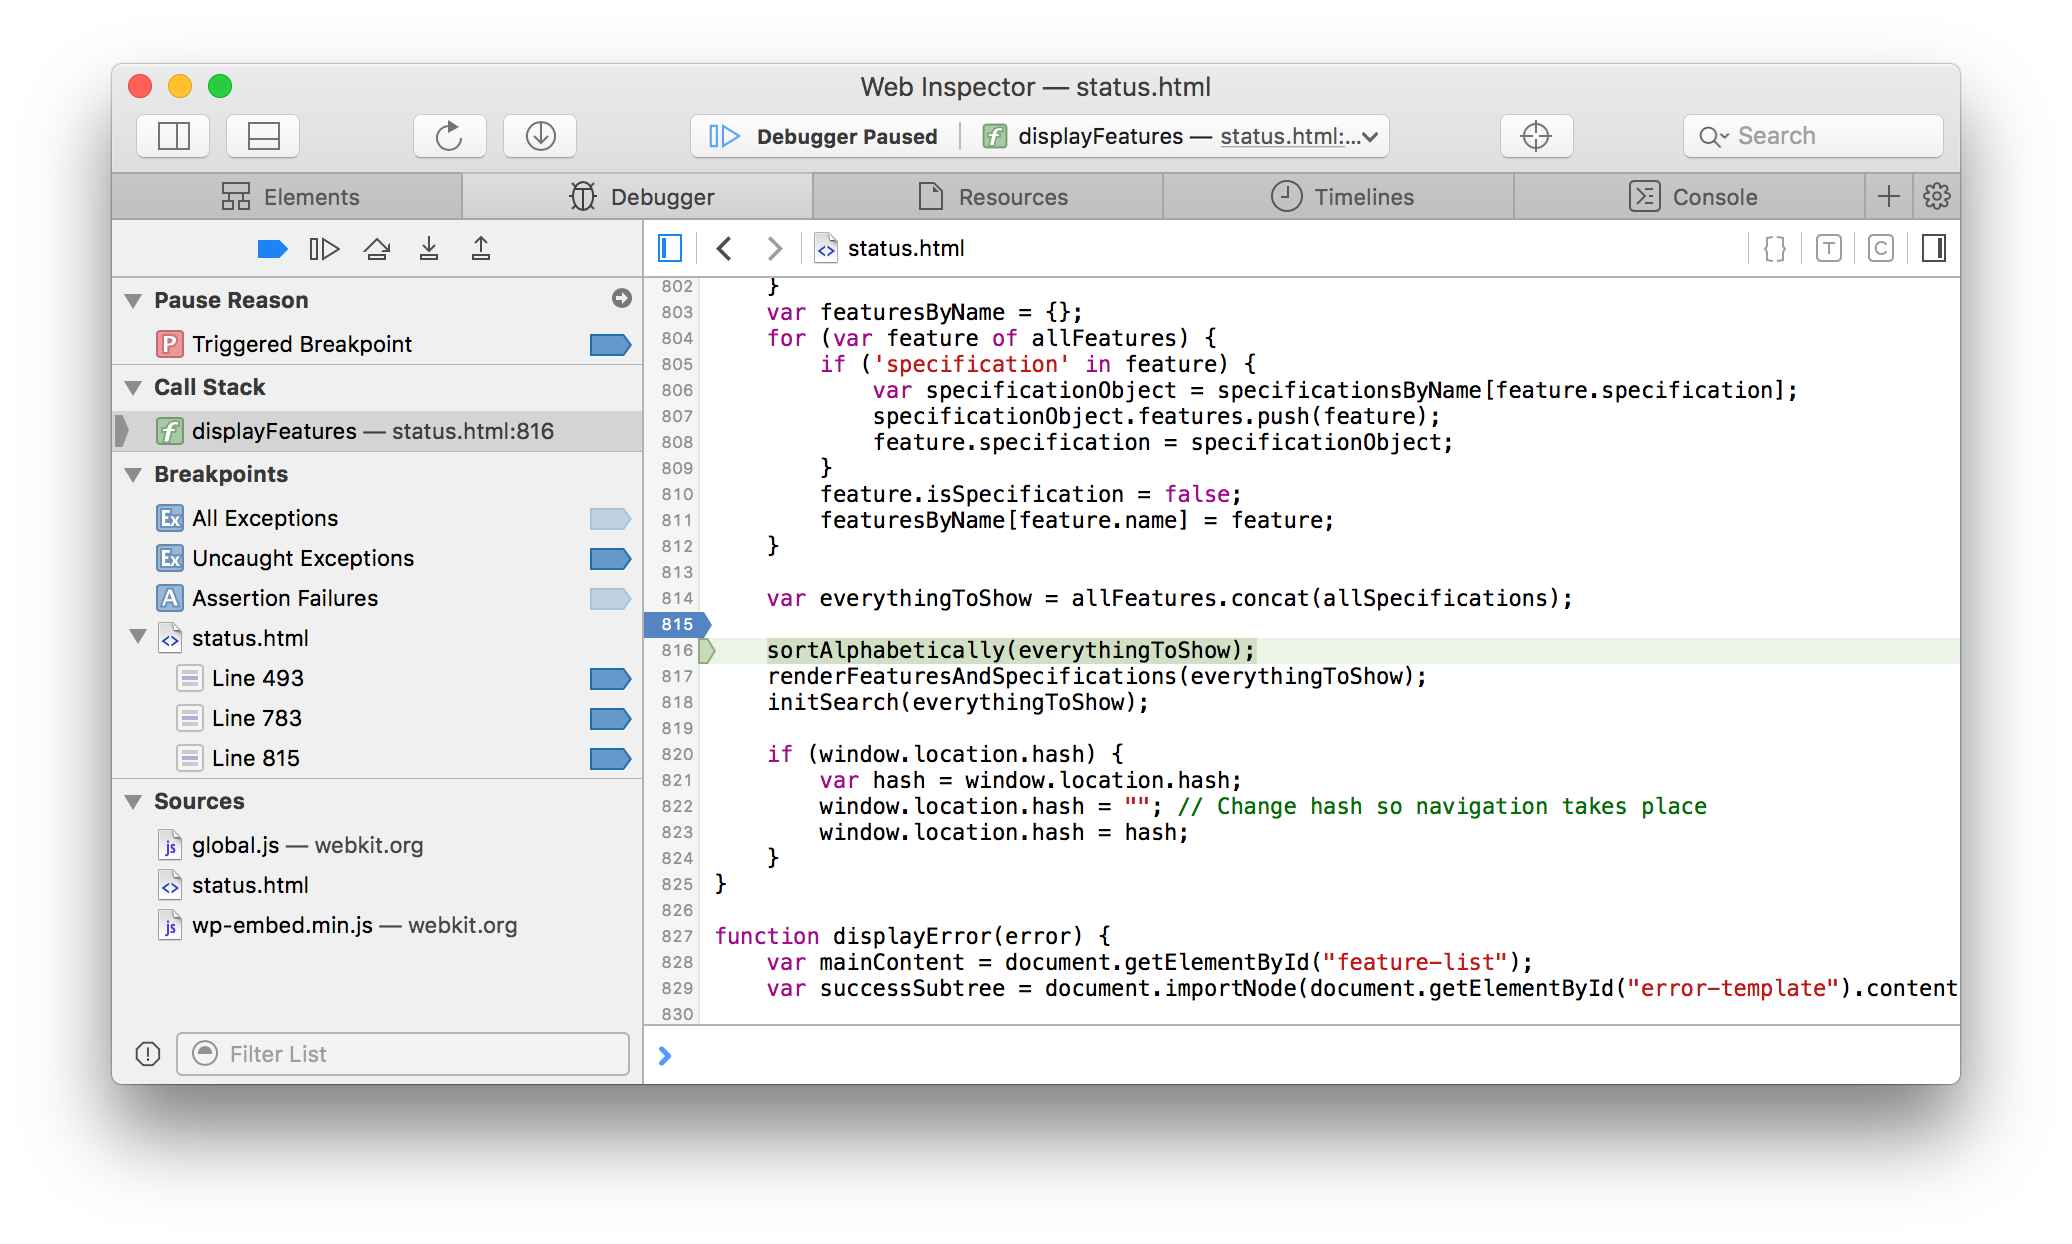
Previously, setting a breakpoint on an empty line or a line with a comment would create a breakpoint that would never get triggered. Now, Web Inspector installs the breakpoint on the next statement following the location where the breakpoint was set.
We also made it simpler to set a breakpoint for a function or method. Previously, you would have needed to find the first statment within the function and set a breakpoint on that line. Now, you can just set a breakpoint on the line with the function name or its opening brace and the breakpoint will trigger on the first statement in the function.
A new global breakpoint was added for Assertion failures triggered by console.assert. This breakpoint can be found beside the existing global breakpoints, such as pausing on uncaught exceptions.
Asynchronous Call Stacks
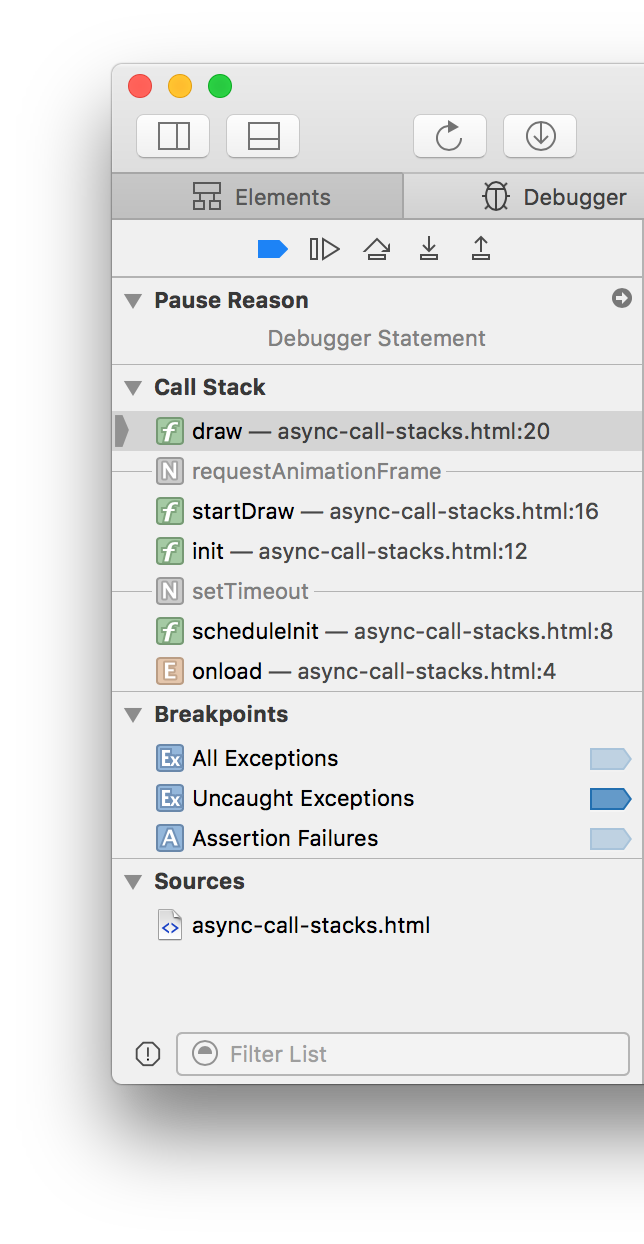
JavaScript functions make it very convenient to evaluate code asynchronously. Callbacks, Events, Timers, and new language features such as Promises and async functions make it easier than ever to run asynchronous code.
Debugging these kinds of asynchronous chains can be complex. Web Inspector now makes it much easier to debug asynchronous code by displaying the call stacks across asynchronous boundary points. Now when your timer fires and you pause inside your callback, you can see the call stack from where the timer was scheduled, and so on if that call stack had been triggered asynchronously.
WebKit currently records asynchronous call stacks in just a few places and is actively bringing it to more features like Promises.
Web Workers
While JavaScript itself is single threaded, Web Workers allow web applications to run scripts in background threads. Web Inspector can now debug scripts in Workers just as easily as scripts in the Page.
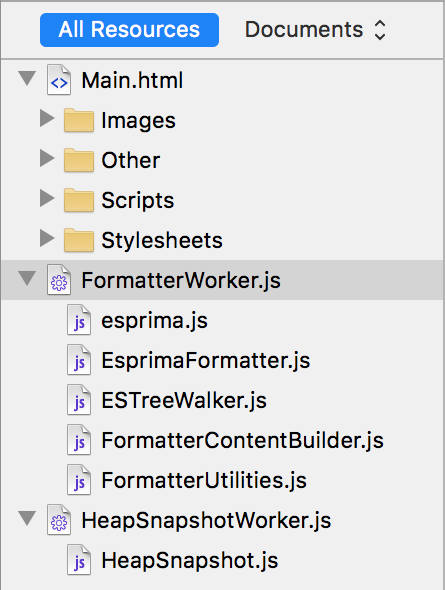
When inspecting a page with Workers, Worker resources will show in the Resources tab sidebar. Each Worker becomes a top level resource like the Page, allowing you to quickly see the list of active Workers and their scripts and resources.
An execution context picker becomes available in the quick console, allowing you to choose to evaluate JavaScript in either the Page’s context or a Worker’s context. Workers have dramatically improved console logging support, so you will be able to interact with objects logged from a Worker just as you would expect.
Setting breakpoints behaves as expected. When any single context pauses, all other contexts are immediately paused. Selecting call frames inside of a particular thread allows you to step just that individual thread. Use the Continue debugger control to resume all scripts.

When debugging a page with Workers, Web Inspector adds a thread name annotation next to the debugger highlights. If you have multiple Workers, or even Workers and the Page, all paused and stepping through the same script you will be able to see exactly where each thread is.
WebKit currently only supports debugging Workers. Profiling Worker scripts with Timelines will come in the future.
Code Coverage and Type Profiling
Web Inspector also supports Code Coverage and Type profiling.
Previously, Web Inspector had a single button to toggle both profilers. A new ![]() button was added to toggle just Code Coverage. The
button was added to toggle just Code Coverage. The ![]() button now only toggles Type Profiler.
button now only toggles Type Profiler.
Feedback
You can try out all of these improvements in the latest Safari Technology Preview. Let us know how they work for you. Send feedback on Twitter (@webkit, @JosephPecoraro) or by filing a bug.