CPU Timeline in Web Inspector
Web Inspector now includes a new CPU usage timeline that lets developers measure a page’s CPU usage, estimate its energy impact, and more easily investigate sources of script execution that may be contributing to poor energy utilization.
Energy Efficiency
Web applications for productivity and entertainment are commonplace. For many users, popular websites are often left open in the foreground of their browser or inactive in a background tab for extended periods of time. The activity on all of these pages may contribute to power drain. Many of the devices used to browse the web are battery powered. To all of those users, battery life matters!
Ensuring web applications make the best use of limited resources is a difficult problem. Having a powerful set of tools makes it easier for developers to investigate and identify performance issues. Many different variables affect energy use on web pages, but the most prominent is CPU activity. Monitoring CPU usage can provide an overall estimate of the energy efficiency of a web page and can highlight cause for concern if activity is too high.
CPU Timeline
The new CPU usage timeline is enabled by default. Open the Timelines tab of Web Inspector and you will see a new CPU timeline in the overview at the top. Select the timeline to show its detail view, which including a breakdown of the main thread activity, an energy impact rating, and more.

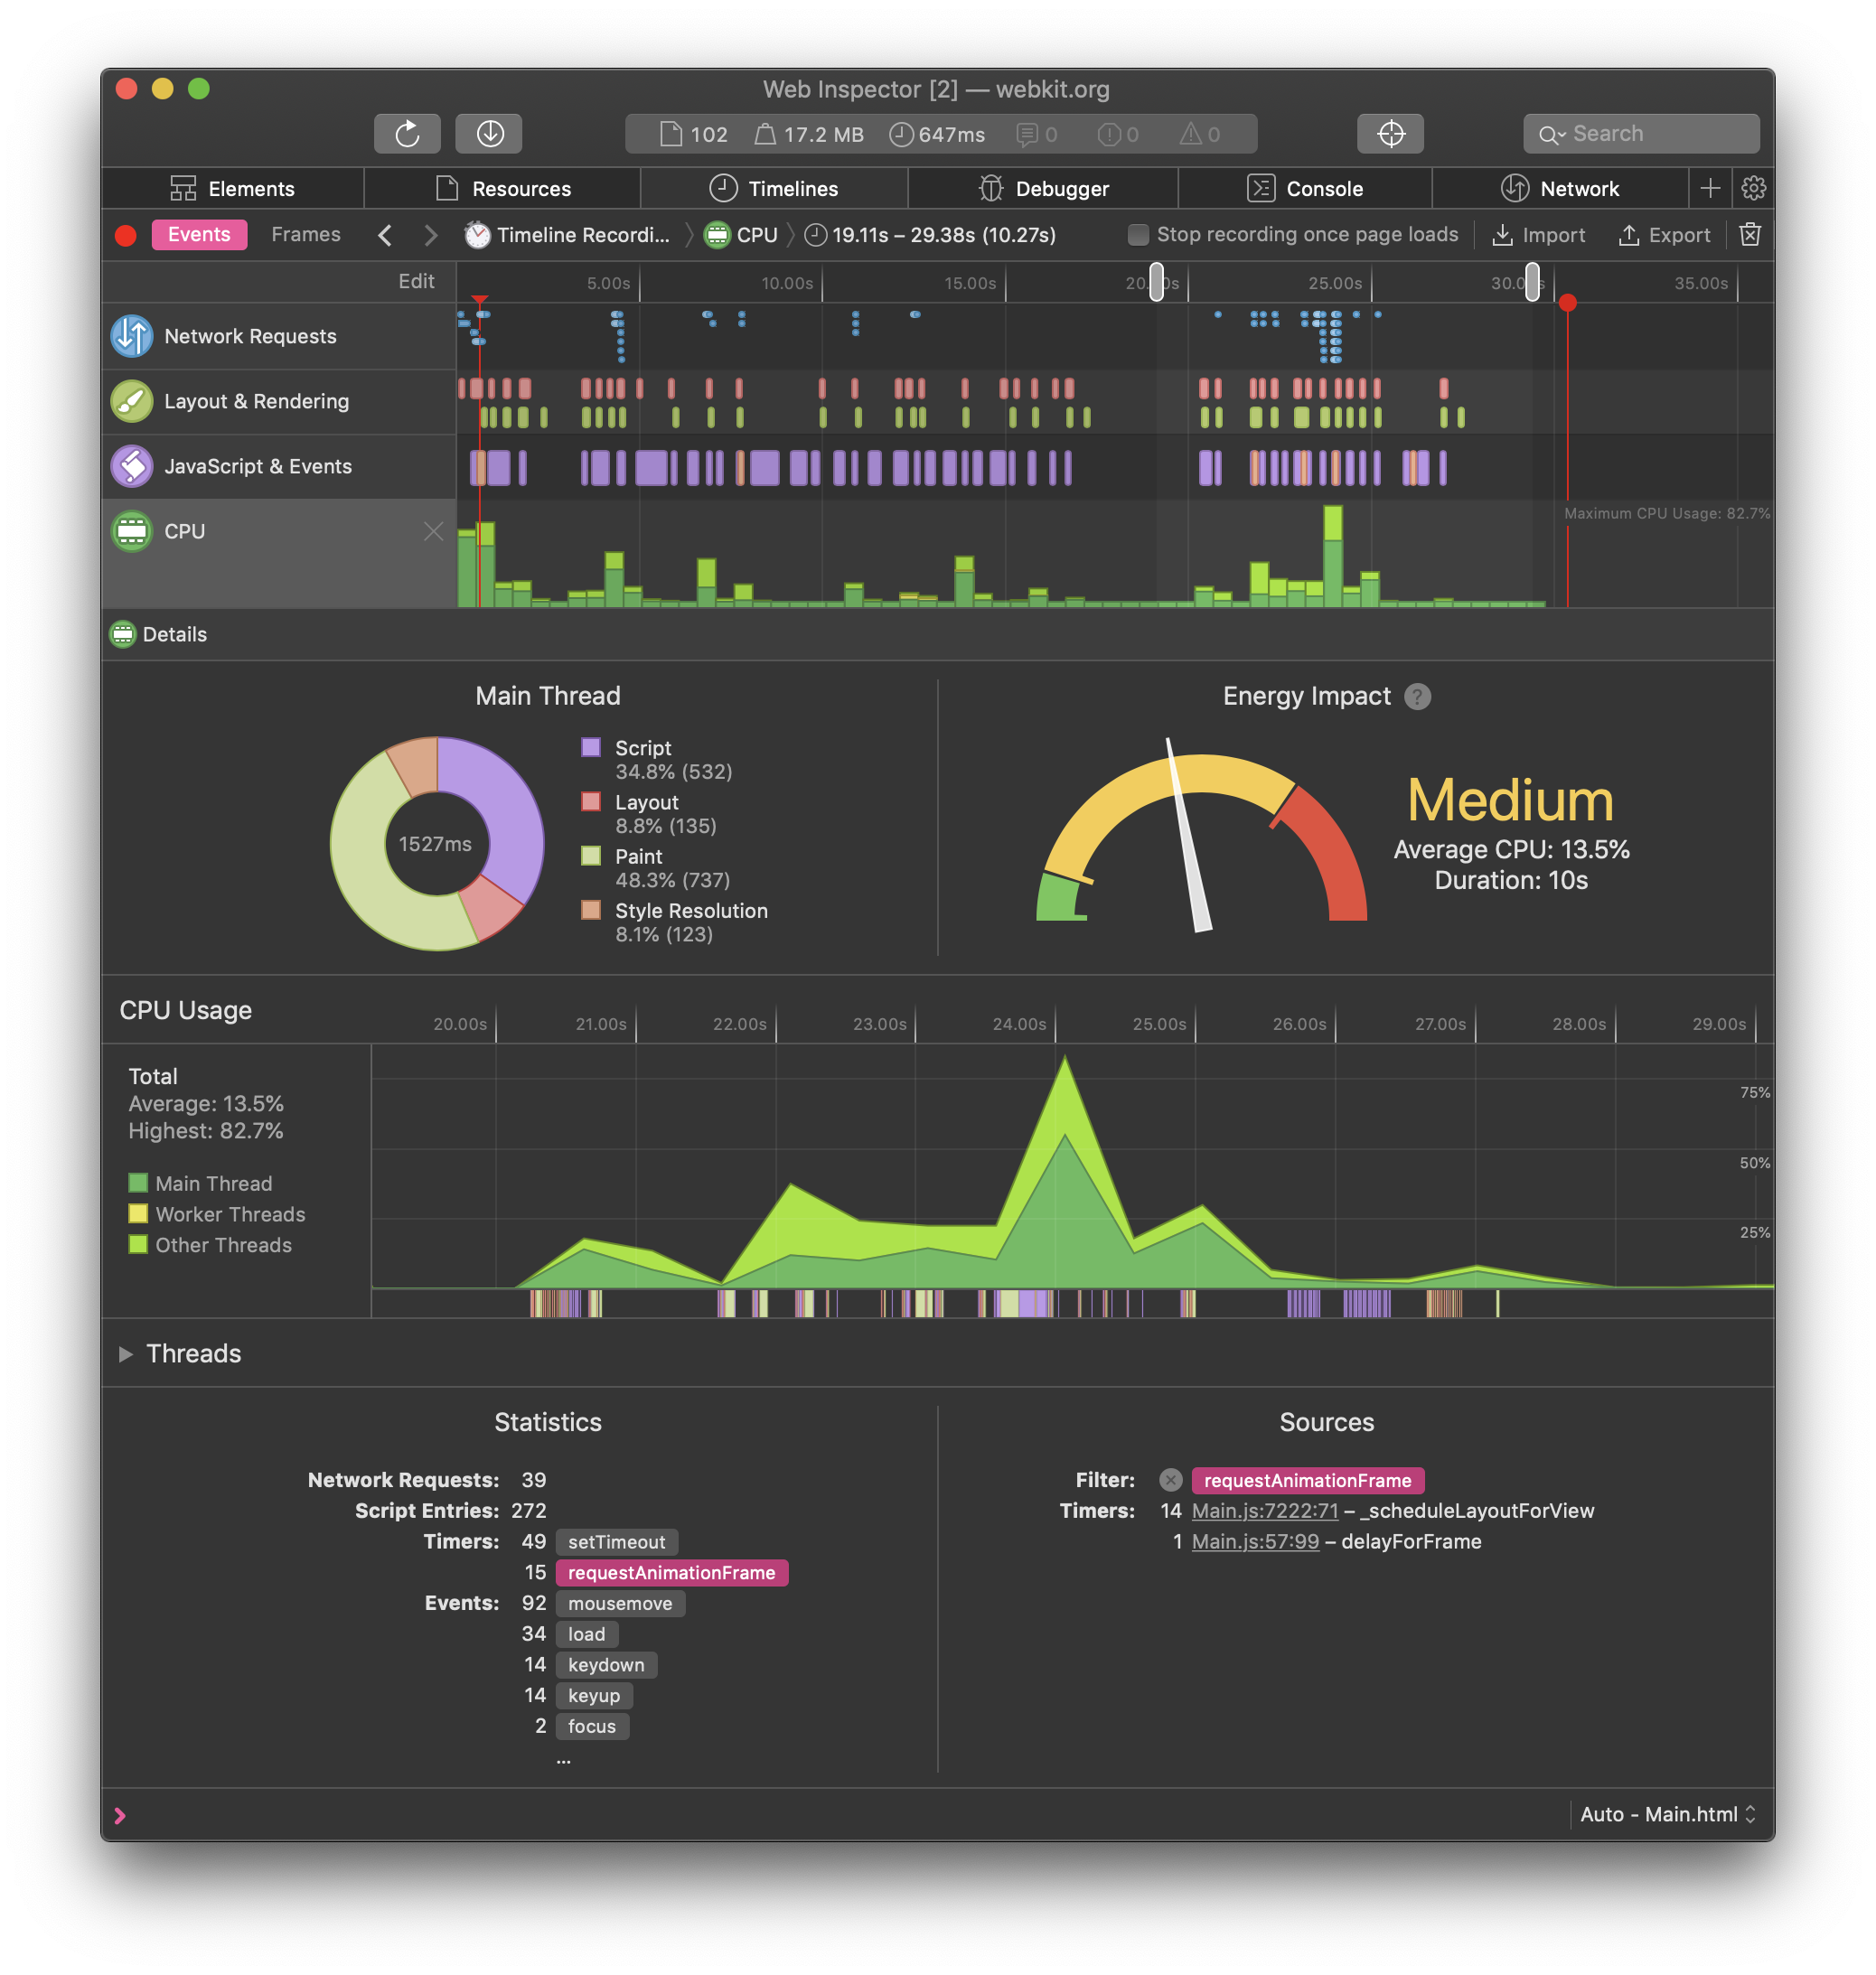
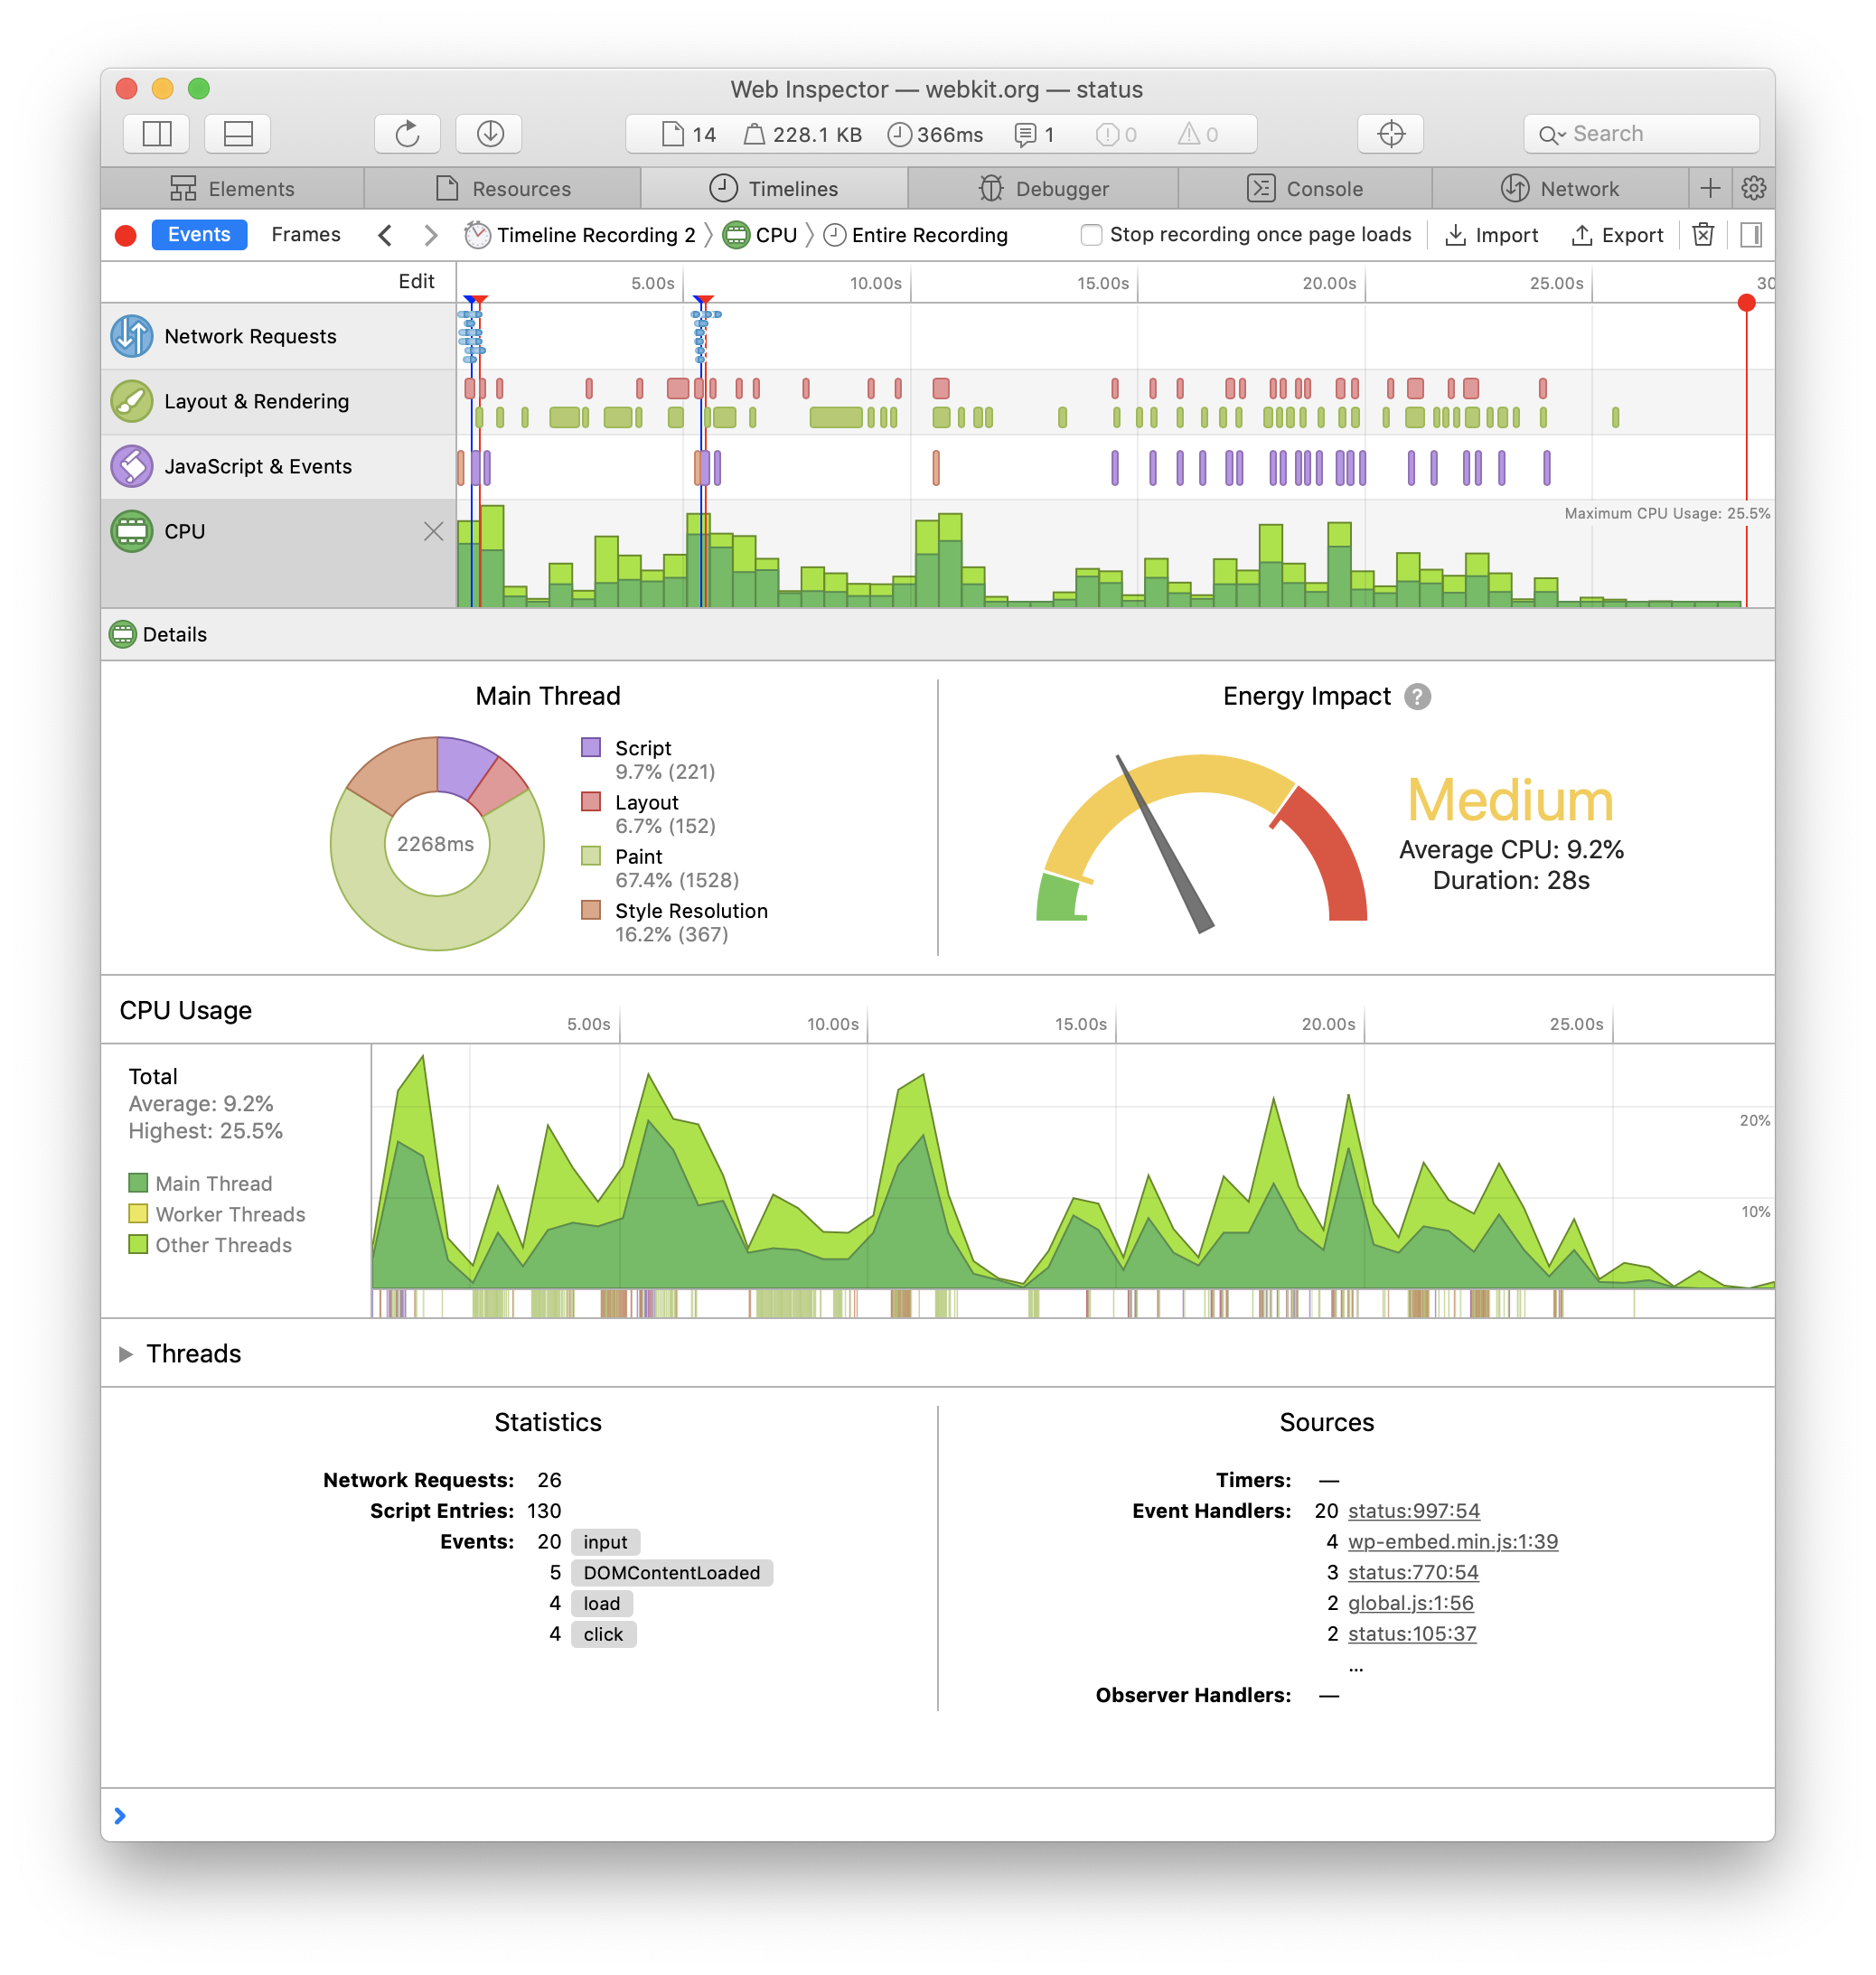
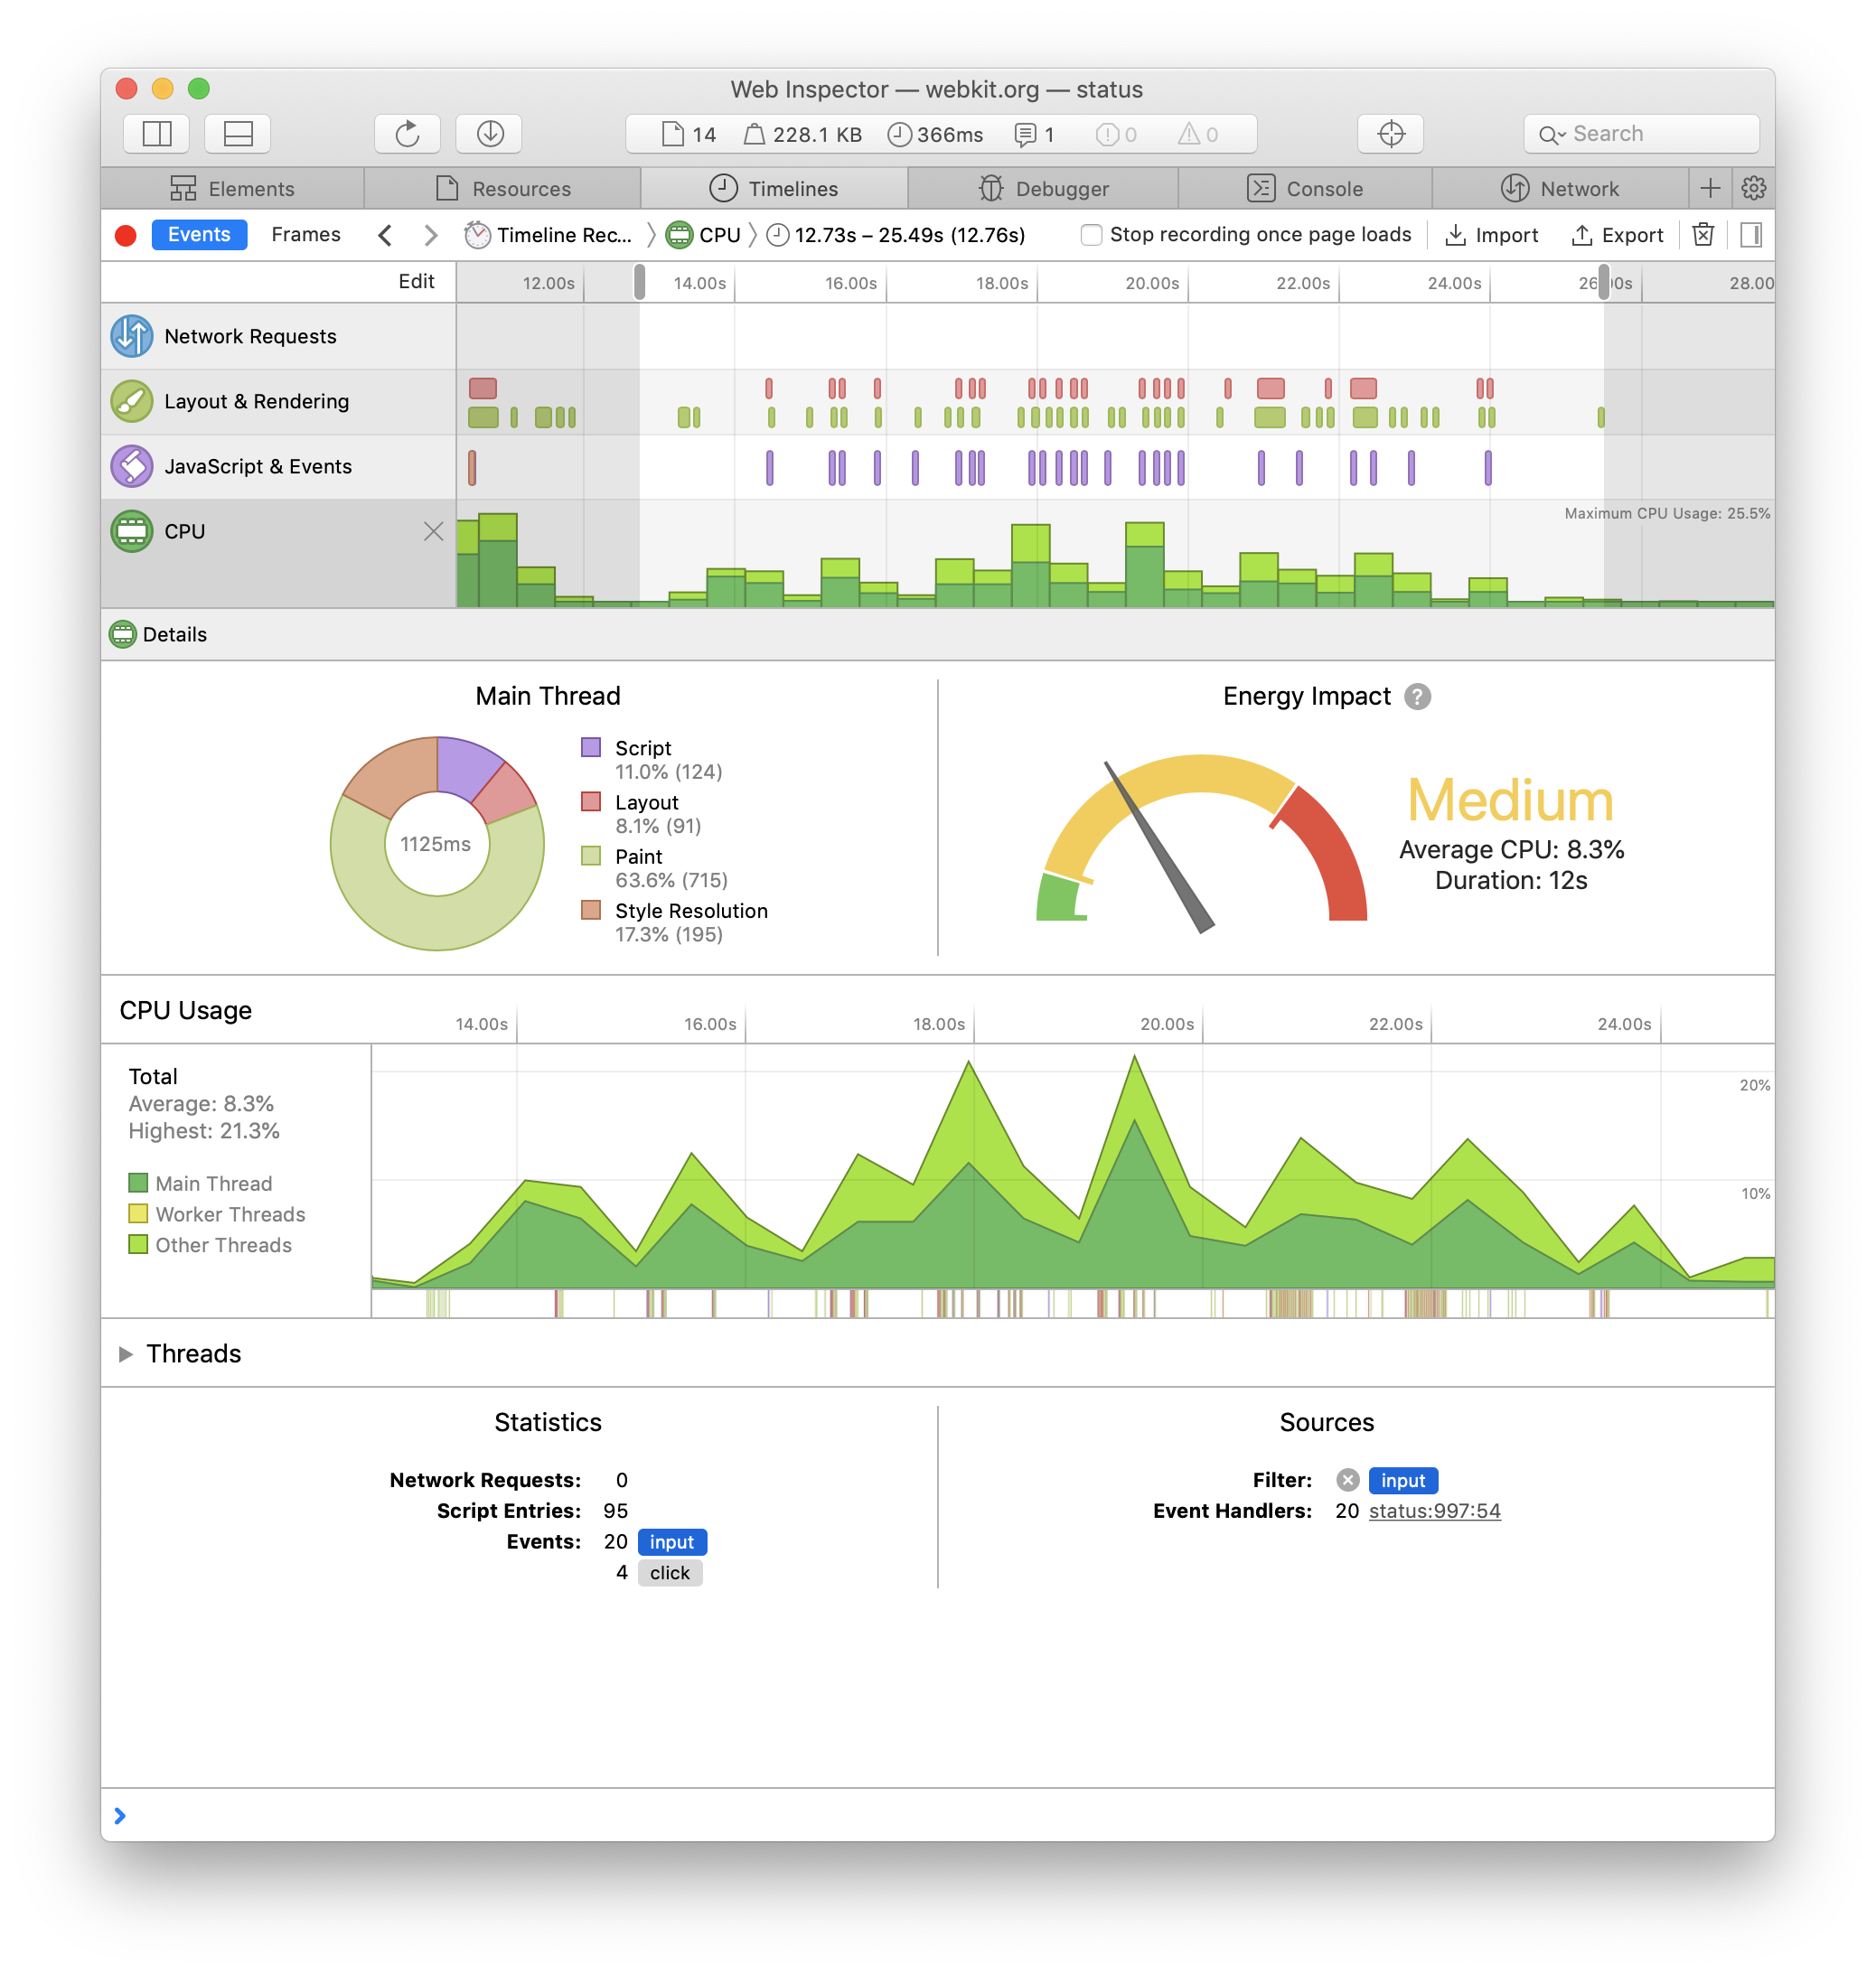
The CPU timeline overview shows CPU usage samples taken every 500ms. You can use these samples to visualize activity spikes, and how they correlate with networking, layout and rendering, and JavaScript. To see a detailed overview of CPU usage in a specific section of a recording, click and drag to make a time range selection.
Main Thread Breakdown
The first section of the detail view is a breakdown of the work being performed on the main thread. While the total CPU usage across all threads is important, the work performed on the main thread is particularly important for web content.

Principal tasks such as evaluating script, painting, layout, and style resolution are performed on the main thread. The chart allows you to quickly see a comparison of where time is spent in each of these categories.
The main thread is primarily active in order to service user interaction events such as scrolling and clicking or tapping on a page. This means that the main thread may have periods of inactivity. The number inside the chart shows the approximate number of milliseconds the main thread was active. This number may be much smaller than the total selected time range in the overview.
Different interactions produce different main thread workloads. For example, scrolling the page will increase the time spent painting, resizing the window will cause additional layouts, and typing into a form may execute scripts.
Energy Impact
The Energy Impact section provides an estimate of the battery drain caused by the page. This is based off of the average CPU usage for the selected time range.
Extended periods of high CPU utilization will show “High” energy impact, since sustained high CPU usage will drain power and have a noticeable effect on battery life. When making use of this section there are two important scenarios to consider and measure:
- Idle recordings – An idle page can be one sitting in the foreground not being interacted with by the user, or a background tab that is still alive. It is important that idle pages use as little energy and CPU as possible. Recordings of idle pages should strive for a “Low” rating (less than 3% average CPU usage).
-
Interactive recordings – Recordings that include interactivity such as navigating, scrolling, clicking, typing, etc. should expect higher CPU usage because the page is responding to the user. Periods of interactivity should strive to maintain a “Medium” rating (less than 30% average CPU usage) and avoid “High” if possible.
While WebKit does work to throttle timers and limit the impact of background tabs or obscured content, idle pages may still perform costly work. Likewise foreground pages that are constantly performing script, such as timers or excessive event handling, may drain battery without any obvious indication.
It is important to select a sufficiently large time range so that a single spike in CPU activity doesn’t dominate the average. Page load for example will briefly use very high CPU activity as the initial cost to download and render the page is high. A short time range selection during page load, or during a period of user interaction with the page, may show a high Energy Impact but may not drain the battery if the usage is not sustained. Normal browsing scenarios have idle periods between loads while users read or more slowly interact with page content. A selection range of 15 seconds or more will produce a more realistic estimate of battery drain than a short selection.
Per-Thread Details
The center of the detail view includes a larger CPU usage graph broken down by thread. The legend shows the different colors for the main thread, worker threads, and other threads. Hover the graph and you get the exact values for the nearest sample. Below the graph is the Main Thread indicator strip. This shows each of the individual samples of main thread activity. Clicking on this strip will take you directly to the event happening at that time in the event’s associated timeline.


For an even more detailed breakdown by individual threads and thread groups you can expand the lower Threads section. While the main thread and worker threads will be individually graphed, the remaining threads are grouped. WebKit threads include any threads performing work known to WebKit such as Garbage Collection, JIT compilation, bmalloc scavanger, and more. CPU usage on any remaining threads are put into an unclassified group.
Statistics and Sources
These sections provide more detailed insight into the activity that occurred on the page within the selected time range.
The Statistics section enumerates different kinds of activities that occured on the page and their individual frequencies. Activity includes network requests and entry into script via timers, events, or observer callbacks. The values are sorted by frequency so you can immediately see the most commonly occurring activities which may warrant investigation.
The Sources section pinpoints and aggregates the sources of entries into script. This includes timer installations, event handlers, and observer handlers. Values are again sorted by frequency so you can immediately see the hottest entry points. For timers, we include the function name where the timer was installed. This makes it easy to detect and investigate unexpected timer registrations.


The two sections work together to make a powerful debugging tool. Categories of script entries can be selected from the Statistics section and the Sources section will filter to show the corresponding script entry points. For example, by selecting requestAnimationFrame the Sources list will immediately filter down to show only the animation timer installations. With one more click you can then jump to the associated code and place breakpoints for further debugging.
Timeline Import & Export
Web Inspector now supports importing and exporting timeline recordings. Now when you capture a recording of a performance issue you can export the recording to share with others, attach to a bug report, or just save for later analysis.
Import and export works across all of the timelines. This makes it useful for all kinds of performance analysis, not just the new CPU timeline. If you captured a recording with an interesting JavaScript and Events profile or one with JavaScript Allocations heap snapshots showing a memory leak, export and import will work great in each of these cases.
Feedback
You can try out the new CPU Usage Timeline in the latest Safari Technology Preview. Let us know how it works for you. Stay tuned for upcoming blog posts on best practices for energy efficient web content. Send feedback on Twitter (@webkit, @JosephPecoraro) or by filing a bug.